


How do I detect ranking losses in Google Search Console before traffic drops? Pull GSC query data daily, baseline it on a trailing window, and run a statistical test on position drift before the clicks line bends.
Position moves first. Impressions decay next. Clicks confirm the damage five to ten days later. A first-party GSC ingestion layer with proper statistical tests catches the first stage, using the ingestion, routing, and agent features already running on the rest of the stack.
The Ingestion Pipeline in One View
Four stages run in order: API extraction, canonicalization, baseline computation, and anomaly scoring. Each stage writes to a date-partitioned table so a replay from any point is a single SQL filter, and the baseline is always reproducible.
Google Search Console retains performance data for 16 months on a rolling basis, after which the oldest day is permanently deleted from the UI and the API. The first day of ingestion fixes the oldest baseline the system will ever hold. Start before the loss, not after.
The raw table carries one row per date, query, page, country, device, and search type. Store the full grain; aggregate at query time. Collapsing dimensions during ingestion destroys the segment attribution needed when an anomaly fires three weeks later and the only question that matters is which segment moved.
Pulling GSC Without Losing Rows
The Google Search Console API caps data at 50,000 rows per day per site per search type, and once queries exceed that ceiling the API returns only the top rows by clicks rather than a complete dataset. Sites with long tail query sets lose exactly the rows that matter most to early detection: queries that recently crossed into the top 50 but have not yet accumulated clicks.
Two patterns avoid the ceiling. The first is dimension slicing: run separate requests per country and per device, then union the results. The second is per-page extraction: iterate the known URL list and pull the query-by-date grain for each. Both multiply the call count, and the Search Analytics endpoint quota absorbs the fan-out for most mid-size catalogs.
Proxy rotation at the API layer handles authentication and backoff. The ingestion stack writes idempotent batches keyed on (date, query, page, country, device), and the scheduler reruns any batch whose row count sits within 5% of the daily ceiling for the next window.
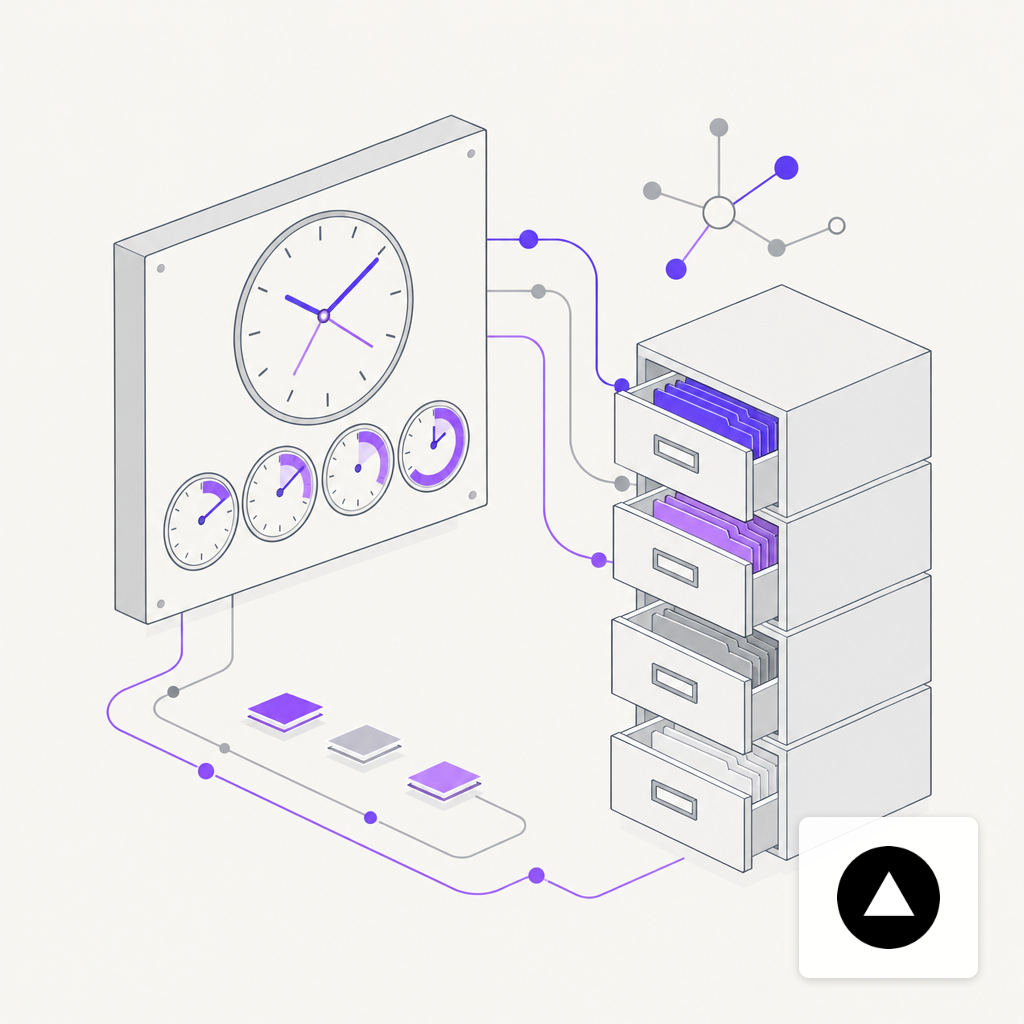
Choosing the Baseline Window
A rolling 28-day window with explicit weekday indexing is the common default. Position has weekly seasonality driven by SERP feature rotation, device mix shifts, and query intent variance on weekends. Comparing today's position to the same weekday across the previous four weeks removes most of that noise.
Core updates contaminate the baseline. The March 2026 Google core update displaced about 24.1% of pages ranking in the top 10 entirely out of the top 100, compared to 14.7% after the December 2025 update. Any test anchored on a baseline that spans an update window will flag the recovery as the anomaly rather than the loss. Exclude known update ranges and widen the window to 56 days when adjacent days are dropped.
Average position itself is a trap. Google reports a tidy average across localized, personalized, device-specific, and feature-affected blocks, so a page shown at position 1 half the time and position 19 the other half reports a tidy 10. Baseline on median and on position quantiles instead.
Statistical Tests That Catch Real Drops
A rolling z-score on position per query-page pair is the cheap first pass. Score each day's position against the baseline window mean and standard deviation. A z above three on two consecutive days triggers the first-tier alert.
Impressions need a different treatment. The distribution is heavy-tailed and sparse at the per-query level, so parametric tests misfire. An EWMA control chart with lambda around 0.2 holds up on moderate volumes. Low-volume queries fall back to a quantile comparison: when yesterday's impressions sit below the fifth percentile of the trailing window, flag and route to triage rather than the primary alert channel.
For trend confirmation, a Mann-Kendall test on the last seven days separates a real decline from a spike-and-return. A CUSUM step-change detector runs in parallel for sites with dense query sets. The published survey literature on univariate time-series anomaly detection catalogues the tradeoffs between these approaches, and production SEO pipelines borrow directly from it rather than invent.
Routing Alerts Through Agents
Alert volume scales with query count. A site with 10,000 active queries and a three-sigma threshold will emit on the order of 27 alerts per day under normal noise, before any real anomaly surfaces. Human triage at that volume degrades quickly.
The two-tier pattern is the usual fix. A cheap model triages each flagged query, writes a one-line verdict, and only escalates survivors to a higher-tier model for root-cause work. The higher-tier agent pulls the canonical URL, inspects the cluster of affected queries, and checks for reindex signals, Core Web Vitals drift, or recent on-page changes. The cost math behind this split is familiar to teams running a multi-agent research runner at monthly scale.
Confirmed anomalies commit to a date-stamped markdown report in Git, with the query cohort, the affected URLs, and the statistical score. The architectural reasons rank tracking breaks in AI search apply here as well: when Search Console reports an average that masks block flattening across AI Overviews and classic results, the detection layer needs to score block-level signals rather than a single scalar.
The Signal That Says It Is Working
Watch the median position delta per query cohort over a rolling three-day window. A two-position drift in the top-10 cohort for three consecutive days is the alerting threshold most production pipelines settle on before paging a human. A one-position drift that persists for seven days is the slower signal worth the same escalation.
If that median starts moving while impressions and clicks are still flat, the pipeline is doing its job. If clicks move first, the baseline window or the detection threshold needs rework before the next core update, and the ingestion primitives sit in the product docs for that review.

Written by
Eric LamannaEric Lamanna is VP of Business Development at Search.co, where he drives growth through enterprise partnerships, AI-driven solutions, and data-focused strategies. With a background in digital product management and leadership across technology and business development, Eric brings deep expertise in AI, automation, and cybersecurity. He excels at aligning technical innovation with market opportunities, building strategic partnerships, and scaling digital solutions to accelerate organizational growth.