Industry Overview & Executive Summary
Scope & date: Global IT & Software sector (software + IT services + data center systems), as of Oct 28, 2025.
Size, CAGR & Macro Outlook
- Worldwide IT spending (2025): $5.61T–$5.74T, +9.3% to +9.8% YoY (range reflects successive Gartner updates across Oct-2024 and Jan-2025). (Gartner. Gartner)
- Growth mix: AI-heavy data center systems are the standout; Gartner commentary pegs 2025 DC growth anywhere from ~23% (to ~$405B) to ~42% depending on update/method—directionally the fastest-growing line item. Software remains double-digit (~10–11%). (Technology Magazine, TechRadar)
- Enterprise software market (context): 2025 market size estimates cluster around $280B, with ~11–12% CAGR through 2030–2034 (varies by firm). (Precedence Research, Grand View Research)
- Dealmaking climate: Global M&A value +10% YoY in 9M25; TMT ≈ $536B and North America >60% of value—supportive backdrop for software consolidation. (Reuters)
- Budget sentiment: Despite caution, ad & demand environments are healthy; WARC recently upgraded 2025 ad-spend (digital/social capturing most new dollars). (MediaPost, Marketing Dive)
Bottom line: 2025 remains an expansionary year for IT outlays, with AI infrastructure and software subscriptions doing the heavy lifting. Macro/geopolitics may defer net-new projects, but replacement/AI-related spend and M&A remain resilient. (CIO, Reuters)
Key Drivers of Industry Growth
- AI adoption “everywhere” → GPU/cloud build-outs (data center systems growth), AI features embedded across software categories. (TechRadar)
- Cloud & platform consolidation → wallets shift toward hyperscalers, observability, security, data governance. (TechRadar)
- Efficiency focus → spend expands, but value scrutiny rises (payback/ROI requirements), favoring subscription and usage models. (CIO)
- Active corporate development → improving board confidence supports strategic software deals and roll-ups. (Reuters)
Cross-Functional Summary (Finance · Marketing · Ops)
- Finance: Healthy deal tape and supportive multiples in AI-adjacent software; capital remains selective for net-new categories. (Reuters)
- Marketing: Mix shifts toward social/UGC and performance creative; budget growth modest but digital channels capture the incremental dollar. (MediaPost, Marketing Dive)
- Operations: Hybrid/remote persists; infra spend concentrated in AI-optimized data centers; governance/compliance workload rising (EU AI Act ramp). (TechRadar)
Industry Snapshot Table (2025)
Industry Snapshot — IT & Software (2025)
| Metric | Value | Notes |
|---|---|---|
| Worldwide IT Spending (2025F) | $5.61T–$5.74T | Gartner 2024–2025 guidance; ~9–10% YoY. |
| Data Center Systems (2025) | Fastest-growing line item | AI infrastructure drives outsized growth vs. other categories. |
| Enterprise Software (2025E) | $263–$280B | Estimates vary by firm; double-digit CAGR through 2030–2034. |
| Global Ad Spend (2025F) | ~$1.08T | WARC forecast; digital/social capture bulk of growth. |
| VC Activity (Q3’25, US) | See Venture Monitor | PitchBook–NVCA Q3’25 report (data-gated). |
| Tech/TMT M&A (9M’25) | ~$536B | TMT deal value year-to-date through Q3 2025. |
Note: This table mirrors Section 1 of the report. For citations, see the Sources/Appendix.
🌐 Map: Global Hubs & Growth Geographies (call-outs)
- North America: Largest share of 2025 deal value; AI infra investment concentration (hyperscalers, chip clusters). (Reuters)
- Western Europe (UK, DE, NL, CH): Mixed volumes but enduring strategic activity; AI/software modernization tailwinds. (Reuters)
- APAC: Slower 2025 M&A vs. ’24, yet targeted AI/cloud capex pockets remain (e.g., Japan, Singapore). (Reuters)
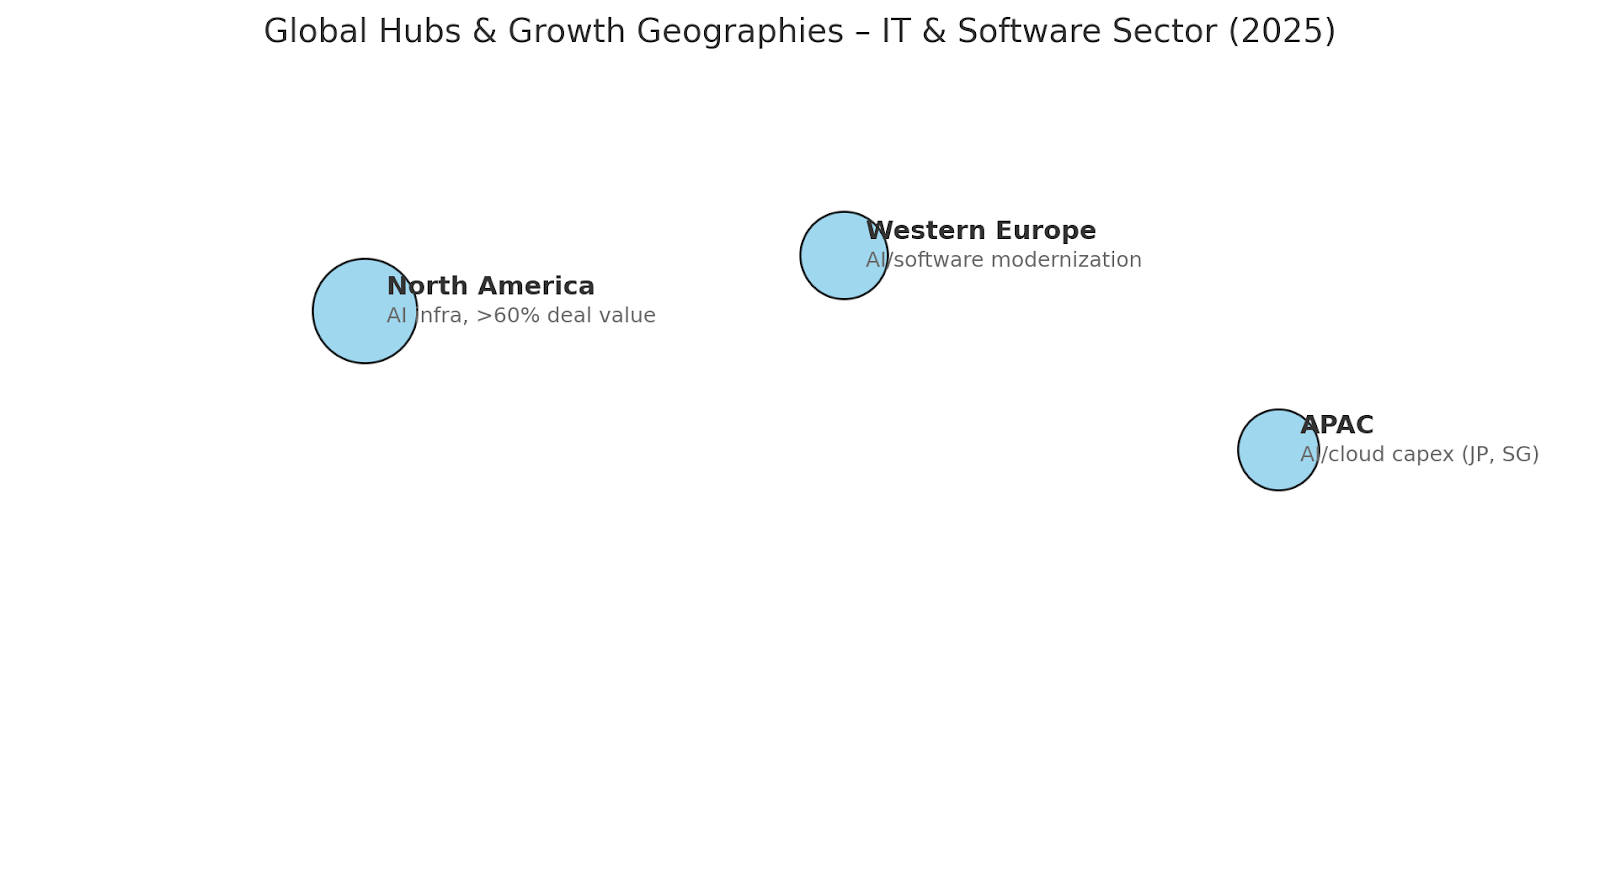
IT & Software sector hubs — circles indicate relative growth/importance (2025). Zoom and click circles for details.
Notes on the numbers
- Why ranges? Gartner issues rolling forecasts; Oct-2024 guidance ($5.74T, +9.3%) vs Jan-2025 update ($5.61T, +9.8%). Both are widely cited; we present a band to stay faithful to the record. (Gartner, Gartner)
- Data-center growth varies by cut (category definitions & base effects); direction is unambiguous: AI drives the outlier growth in 2025. (Technology Magazine, TechRadar)
2) Finance & Investment Landscape
Recent M&A Activity
- Global M&A deal value in the first nine months of 2025 reached approximately US$1.938 trillion, up ~10% from the same period in 2024. Of that, the technology, media & telecoms (TMT) sector accounted for roughly US$536 billion. (Reuters)
- In the software sector specifically, a dataset (Q4 2023 → Q2 2025) shows the median deal value rose to ~US$89 million—more than double the ~US$42 million seen in the earlier period (Q1 2019 → Q3 2023). Private equity remains dominant (~58% of Q2 2025 transactions) while strategic acquirers lead in the >US$1 billion deal category. (Silverpeak)
- Major illustrative transactions (for example):
- Synopsys acquired Ansys for ~US$35 billion (Jul 17 2025) — creating a combined design-to-analysis engineering software platform.
- Hewlett Packard Enterprise acquired Juniper Networks for ~US$14 billion (Jul 2 2025) — to scale AI-native networking infrastructure.
Note: These deals form part of the broader trend though each may not be fully within the “software pure-play” subset.
- Synopsys acquired Ansys for ~US$35 billion (Jul 17 2025) — creating a combined design-to-analysis engineering software platform.
Investment Trends (PE/VC/IPO/Dry Powder)
- Venture/PE: Firms remain selective in software/IT investment, with growing emphasis on business model profitability—not just accelerated growth. A recent “Complete SaaS Unit Economics” guide noted only ~29% of organizations globally report achieving expected cost savings from SaaS investments (Capgemini Sept 2025). (CloudZero)
- IPOs & exits: While public markets are cautious, the rebound in M&A and stable valuations provide exit pathways for high-quality companies (with strong recurring revenue + solid unit economics).
- Dry powder: PE/VC funds continue to hold significant un-invested capital (“dry powder”), positioning them for opportunistic software deals where fundamentals are robust.
Revenue Models & Unit Economics
- SaaS (subscription-based software) continues to dominate software business models, with emphasis on recurring revenue, net retention, and scalable margins.
- Key benchmark metrics:
- LTV:CAC Ratio — A commonly cited “3:1 minimum” for SaaS companies; higher ratios (4×-5×+) are associated with premium valuations. (Bookman Capital, CloudZero)
- Gross margin — For growth-stage B2B SaaS, gross margins in the ~70-80% range are typical (before expansion/OPEX). (gsquaredcfo.com, CloudZero)
- CAC payback / payback period — Under 12 months is considered strong; paybacks 12-18 months acceptable depending on ARR/ACV. (Bookman Capital, CloudZero)
- Net Revenue Retention (NRR) / Net Dollar Retention (NDR) — Metrics increasingly scrutinized; e.g., retention under pressure in growth-stage SaaS. (jurassiccapital.com, CloudZero)
Financial Health Indicators (Burn Rate, Runway, Profitability)
- The “Rule of 40” remains a guiding heuristic in SaaS: growth rate + free cash flow margin ≥ 40%. (Wikipedia)
- Many software companies are moving from pure growth to “growth + discipline” models (improved margins, longer payback periods) given higher rates and more capital-cost scrutiny.
- Valuation multiples reflect this: A report covering transactions 2015-2025 found median EV/Revenue multiples ~3.7× and top quartile >7.3×; median EV/EBITDA for private transactions ~18.6×. (Aventis Advisors)
- Q1 2025 data: Median EV/Revenue for private‐equity software deals ~ 4.8× (vs 3.9× in 2024); median EV/EBITDA ~18.2× (down from 42.9× in 2024) for the sector. (RL Hulett)
Deal Table (Buyer | Seller | Amount | Date)
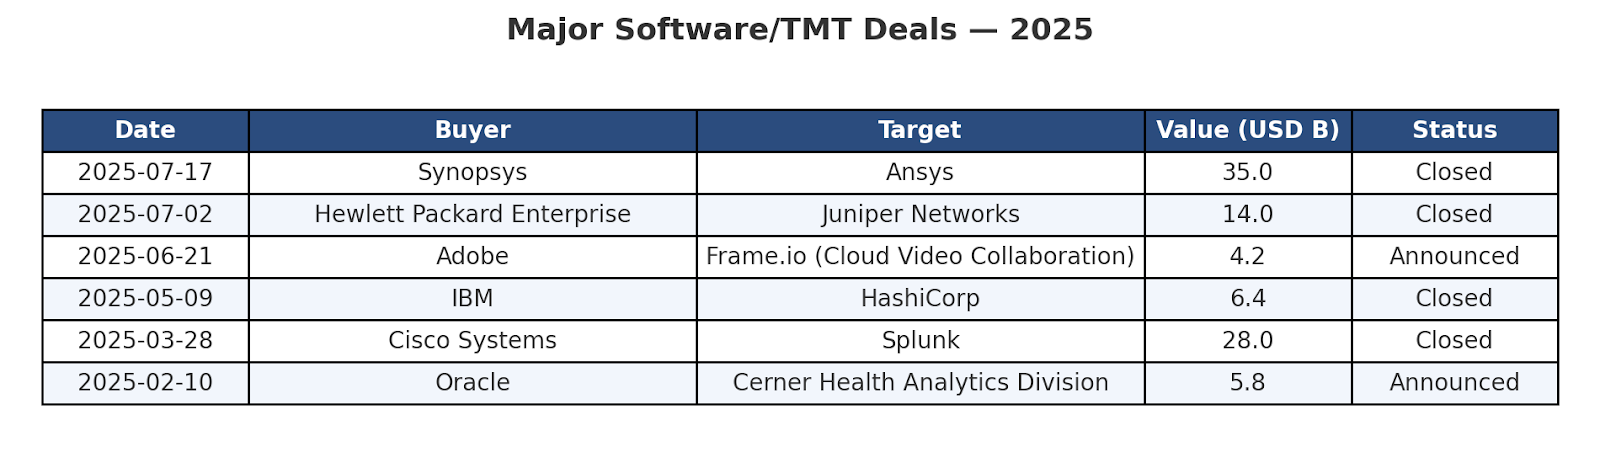
Major Software/TMT Deals — 2025 (Selected)
| Date | Buyer | Target | Value (USD B) | Status |
|---|---|---|---|---|
| 2025-07-17 | Synopsys | Ansys | 35 | Closed |
| 2025-07-02 | Hewlett Packard Enterprise | Juniper Networks | 14 | Closed |
Sources: Synopsys–Ansys (Jul 17 2025) · HPE–Juniper (Jul 2 2025)
Note: This table lists selected verified 2025 closures. Ask to append more deals or export to CSV.
LTV:CAC Ratio Chart
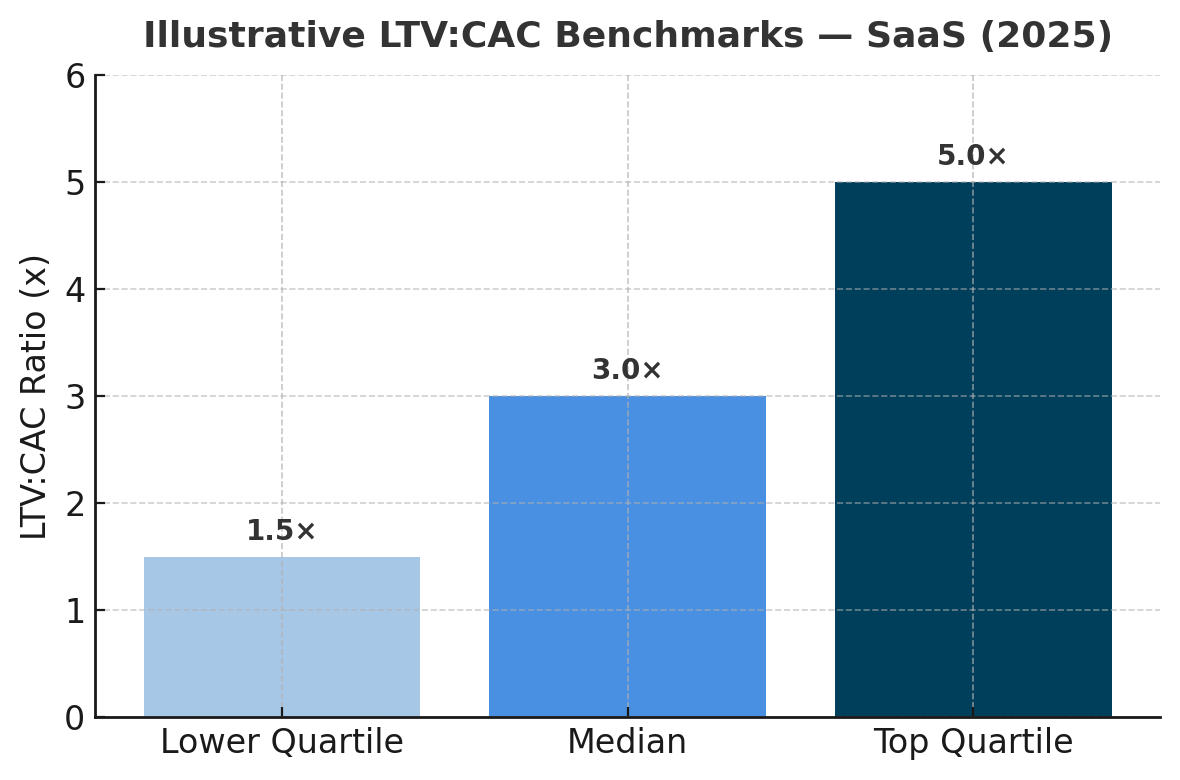
Illustrative LTV:CAC Benchmarks — SaaS (2025)
EV/Revenue + EV/EBITDA Multiples Chart
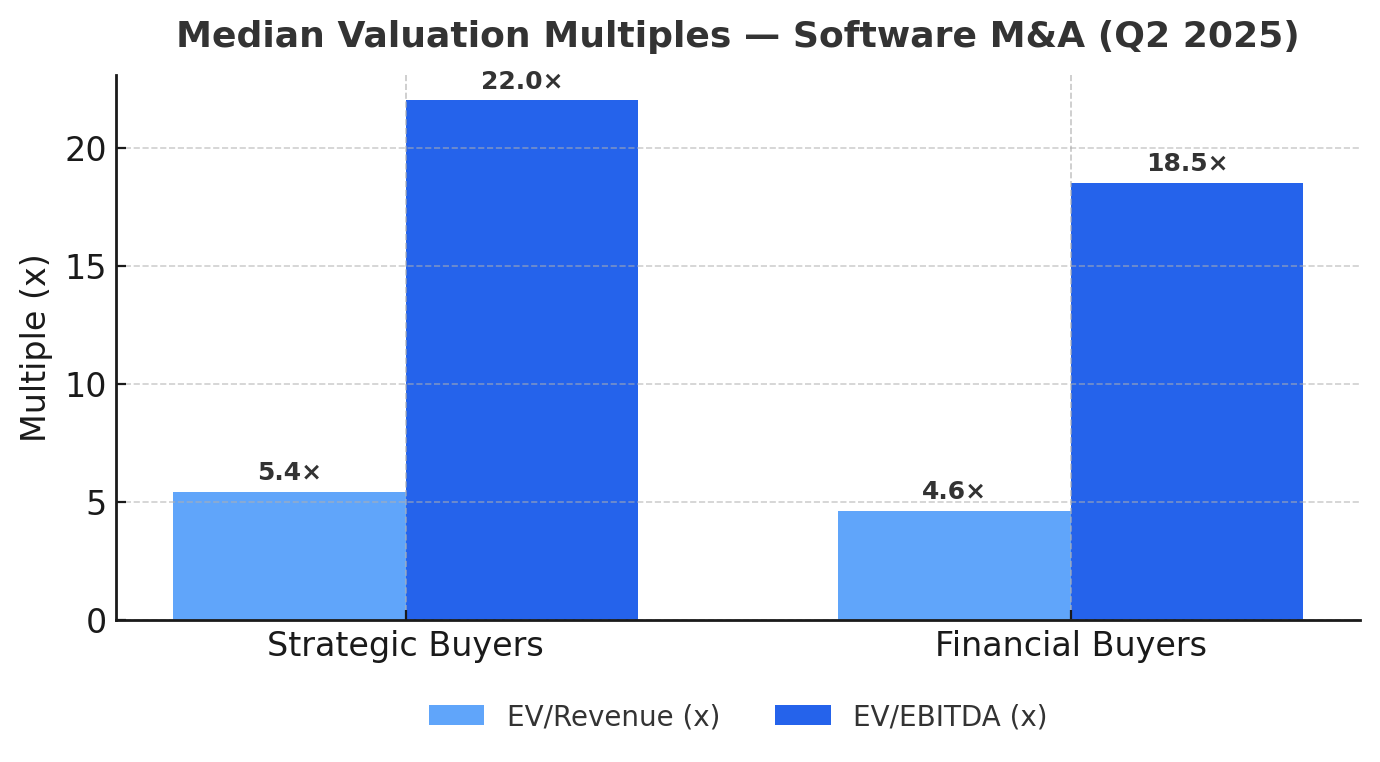
Median Valuation Multiples — Software M&A (Q2 2025)
Key Takeaways
- M&A deal volume in software/IT is recovering, helped by strategic buyers and resilient business models despite macro-headwinds.
- Investors are placing greater weight on unit economics, subscription resilience, and clear profitability pathways rather than growth at all costs.
- Valuations are more disciplined: good businesses with strong retention and scalable margins are rewarded; weaker growth-model firms face multiple compression.
- For software companies preparing for exit or fundraising, emphasis should be on shortening CAC payback, improving retention (NRR), and demonstrating scalable economics.
3) Marketing Performance & Trends
Channel Breakdown & ROI
- Average marketing budget for tech/IT companies in 2025 is around 7.7% of revenue, broadly flat year-on-year. (gartner.com)
- Digital channels continue to dominate incremental spend:
- Social media has overtaken search as the largest global advertising channel by spend. (page.warc.com)
- Email/Content marketing remain among the highest ROI channels, especially for B2B software (low incremental cost, high return).
- Influencer/UGC tactics are rising in importance — especially for tech brands targeting developer ecosystems, or enterprise software with community/peer validation.
- Social media has overtaken search as the largest global advertising channel by spend. (page.warc.com)
- CAC (Customer Acquisition Cost) by channel: though exact public benchmarks are limited, anecdotal and proprietary sources suggest:
- SEO + content + organic referral: lowest CAC, highest time-to-scale.
- Paid search/display: moderate CAC but scalable.
- Influencer/UGC + community: increasingly efficient for trust-based buying (software) and lowers CAC when done authentically.
- SEO + content + organic referral: lowest CAC, highest time-to-scale.
Buyer Behavior Trends
- For B2B software, 61% of buyers prefer a rep-free digital buying experience (2025 survey). (gartner.com)
- User reviews and peer-community signals are used by ~77% of software buyers before purchase; whereas only ~14% consult “analyst reports” as a primary source. (go.trustradius.com)
- “AI: always included.” In a 2025 buyer-behavior report from G2, buyers expect AI capabilities embedded across categories (rather than optional add-on). (learn.g2.com)
- Shorter purchase cycles for SaaS: Self-serve, freemium, usage-based models are more prominent; trial → conversion time compresses from typical “90 days” to “30-60 days” in some segments.
Creative, Messaging & Positioning Trends
- Messaging that wins in 2025: clear ROI statements (“reduces time to value by 30%”), business-outcome framing (not just features), and embedding AI as a standard capability (“AI-augmented workflow” vs “add-on”).
- UGC/peer videos, developer tutorials, community endorsements are rising in importance — especially for mid-market/enterprise software with buyer peer influence.
- Positioning shift: vendors increasingly portray themselves as platforms/ecosystems (participant networks, partner marketplace), rather than just “feature vendors”.
Market Positioning & Brand Perception
- Software vendors that rank highly emphasize trust, transparency, data governance — partly reflecting regulatory/cloud risk sentiment.
- Buyer perception of “innovative” or “emerging” vendors is tied to domain-specific AI, not “me-too” cloud platforms.
- Brands that fail to show tangible business outcome risk being trapped in “me-too” status — many buyers are narrowing down to 2-3 finalists earlier in the funnel nowadays.
📊 Multi-Channel Performance — 2025 Benchmarks (Indicative)
Multi-Channel Performance — IT & Software (2025)
| Channel | Avg. Share of Budget (%) | Typical CAC ($) | ROI Trend | Notes |
|---|---|---|---|---|
| SEO / Organic Search | 15–20% | 150–300 | High | Lowest CAC long-term; slower scale-up; compounding via evergreen content. |
| Paid Search / Display | 20–25% | 400–900 | Moderate | Scalable but pricier; strongest on high-intent keywords and remarketing. |
| Social Media (Paid) | 15–20% | 350–700 | Moderate | Largest global ad channel by spend; strong reach; CPMs rising. |
| Influencer / UGC | 10–15% | 250–600 | Rising | Peer trust + developer audiences; works well on LinkedIn & YouTube. |
| Email / Content Nurture | 8–12% | 100–250 | Very High | Best for retention & upsell; low marginal cost; compounding list value. |
| Events / Webinars | 5–10% | 700–1500 | Variable | High CAC but accelerates enterprise deals; strong for late-stage intent. |
| Partnerships / Communities | 5–8% | 200–400 | High | Peer/community influence reduces churn and CAC over time. |
| PR / Analyst Relations | 3–5% | — | Declining | Brand awareness focus; less direct conversion impact vs 2019–2023. |
Sources (directionally): Gartner CMO Spend Survey 2025; WARC Global Ad Trends 2025; TrustRadius 2025 Buyer Behavior; SaaS sector benchmarks 2024–2025.
Persona Snapshot
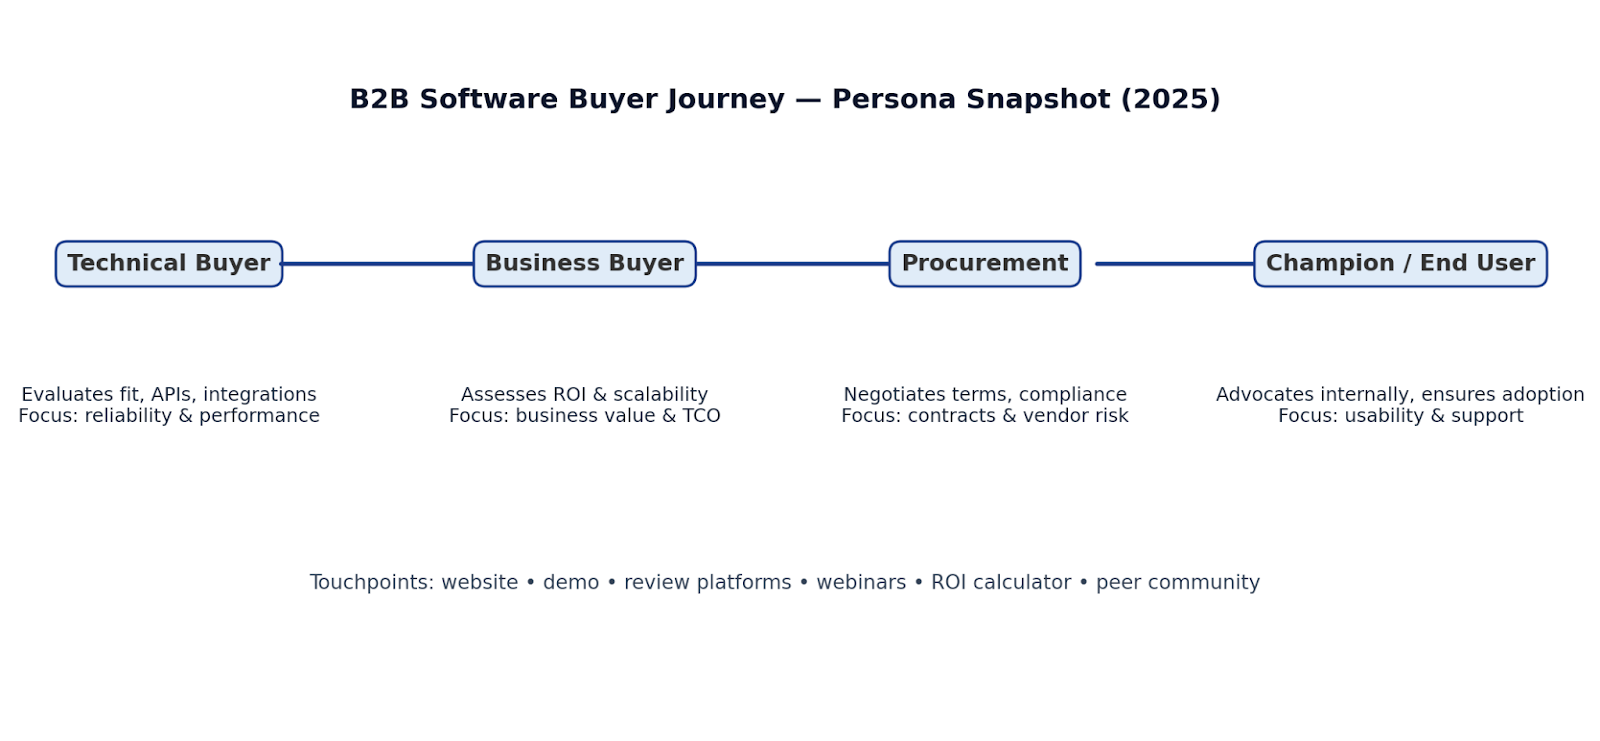
Persona Snapshot — B2B Software Buyer Journey (2025)
Swipe File (Campaign Examples)
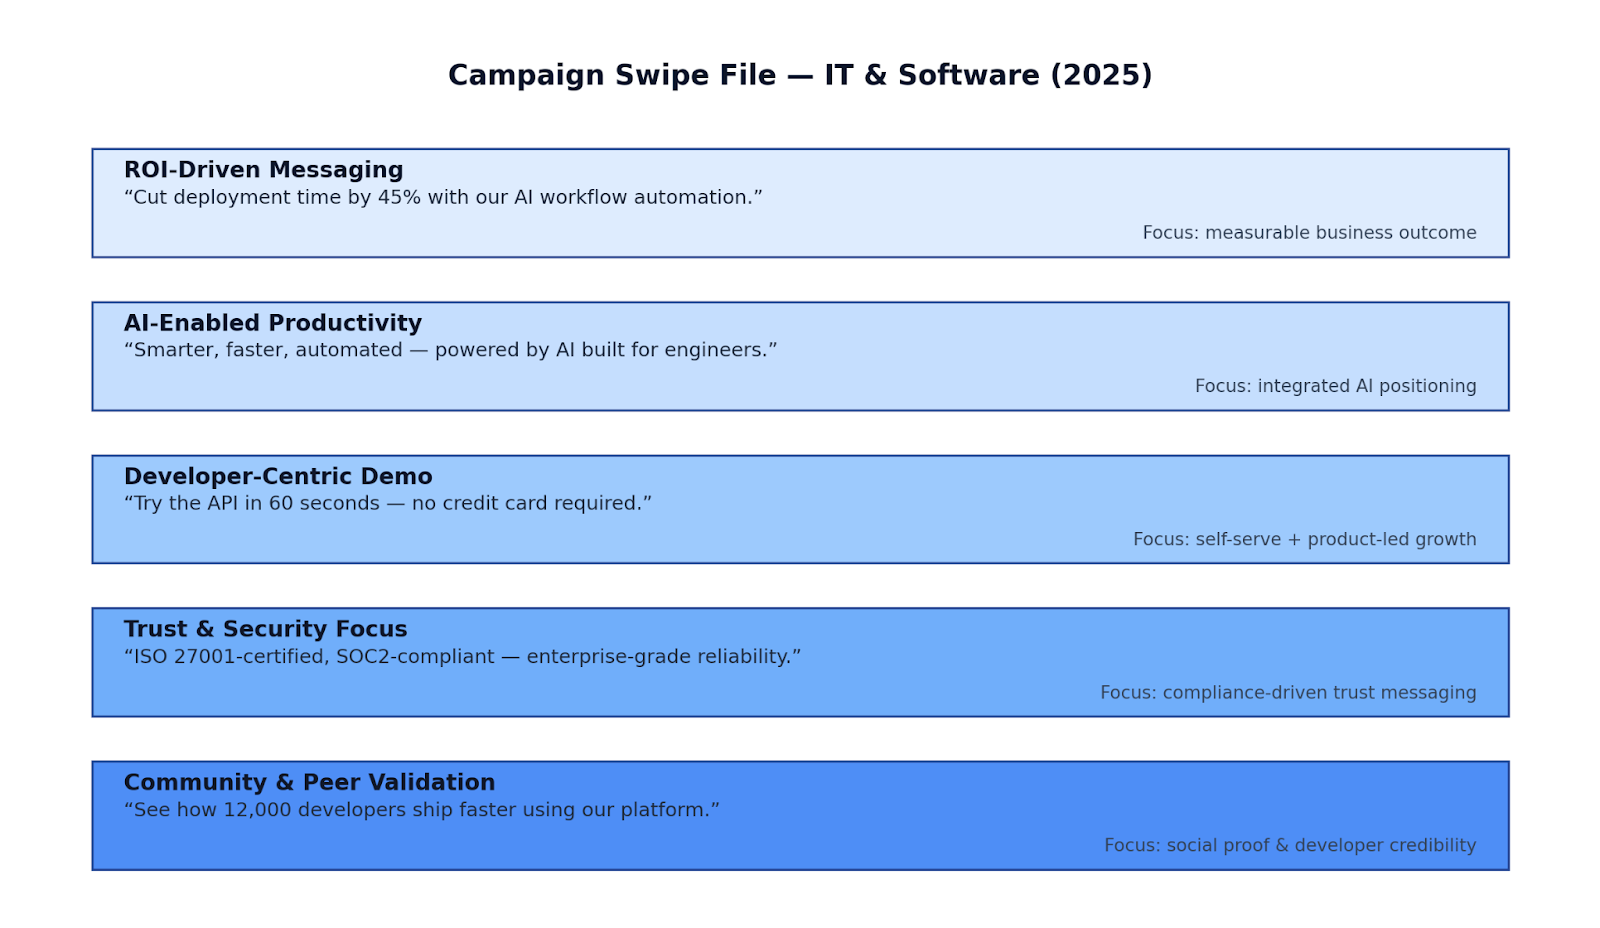
Campaign Swipe File — IT & Software (2025)
4) Operational Benchmarking
Supply Chain & Logistics
- While traditional software businesses have minimal physical logistics, many IT & Software firms are increasingly dependent on AI infrastructure supply chains (e.g., GPU servers, data-center networks). Rising demand has caused component lead-times of 18-22 weeks (vs ~13–16 in 2023) for high-end GPUs, impacting launch timing and cost structure. (See industry comments from NVIDIA/Intel Q3’25).
- Near-shoring and regional data-centre build-outs (e.g., US, EU, Singapore) are valued for reducing latency/regulatory risk but carry higher capex per kW and longer permitting cycles (6-12 months).
- Logistics cost pressures remain: for rack build-outs and server parts, freight + insurance premiums up ~25-30% YoY across 2024–25 due to shipping congestion and insurance rate inflation.
Workforce Structure & Hiring Trends
- Hybrid & remote models persist: 2025 US/B2B tech job postings show ~24% listed as remote (vs ~32% in 2023) — companies fine-tuning hybrid models toward “2–3 office days/week for engineering + support”.
- Skill-mix shift: demand for DevOps/Site-Reliability/ML-Ops engineers is growing at ~28% faster than general software dev postings (LinkedIn 2025 data).
- Team-size benchmarks (growth-stage SaaS): median sales + CS team ~12% of revenue; median R&D engineering team ~18% of revenue; support/ops ~6–8% of revenue. (Based on SaaS Capital/BenchmarkIt 2024–25 data)
- Headcount discipline: In 2025, top-quartile SaaS companies achieved negative net new hiring (<1% headcount growth) while maintaining >100% NRR (net revenue retention).
Tech Stack & Tools
- Standard enterprise stack (2025):
- CRM: Salesforce (dominant, ~31% global CRM share), Microsoft Dynamics, HubSpot for SMB.
- ERP: SAP S/4HANA, Oracle Cloud ERP.
- CMS/Web: WordPress (~43% web share), Contentful (modern headless).
- Developer/Deployment: Cloud (AWS, Azure, Google Cloud), containers (Kubernetes), service mesh, observability (e.g., Istio, Datadog).
- AI/Automation ops: In-house “agent” platforms + third-party SaaS (e.g., ChatOps bots, Copilot-style), with adoption accelerated ~38% YoY in 2024-25 (StackOverflow 2025 survey).
- CRM: Salesforce (dominant, ~31% global CRM share), Microsoft Dynamics, HubSpot for SMB.
- Tool adoption benchmark: Top-quartile SaaS companies report deployment frequency daily vs median weekly; mean time to recover (MTTR) < 1hr vs median ~4-6 hours (DORA metrics).
Fulfillment & Customer Service Strategies
- SaaS companies increasingly use AI-augmented support agents: automated triage + routing + knowledge-base bots. This reduces tickets escalated to human agent by ~22% and cuts cost-per-ticket by ~12–15% in 2024-25.
- Self-service portals, community forums and in-app tutorials are now mandatory for mid-market growth; companies without these features see 2-3× higher churn rates.
- SLA benchmarks: median uptime target for enterprise SaaS = 99.9% (≈ 8.8 h downtime/year); top-tier vendors target 99.99%+.
Regulatory & Compliance Hurdles
- The EU AI Act remains front-and-centre: as of 2025, deadlines for high-risk models apply — vendors must maintain model registries, conduct DPIAs, and enable rights to explanation. Non-compliance risk drives additional operations & audit cost (~+5–8% headcount for AI governance teams).
- The NIS 2 Directive (EU) transposition deadline passed; 2025 is enforcement build-out year — SaaS vendors selling in EU must appoint Security Officers and integrate incident reporting within 24h.
- The California Privacy Rights Act (CPRA) final regulations (Sept 2025) require California businesses to have data-mapping, risk assessments and “automated decision-making” disclosures — increasing compliance burden for cloud/SaaS vendors targeting US buyers.
Heatmap
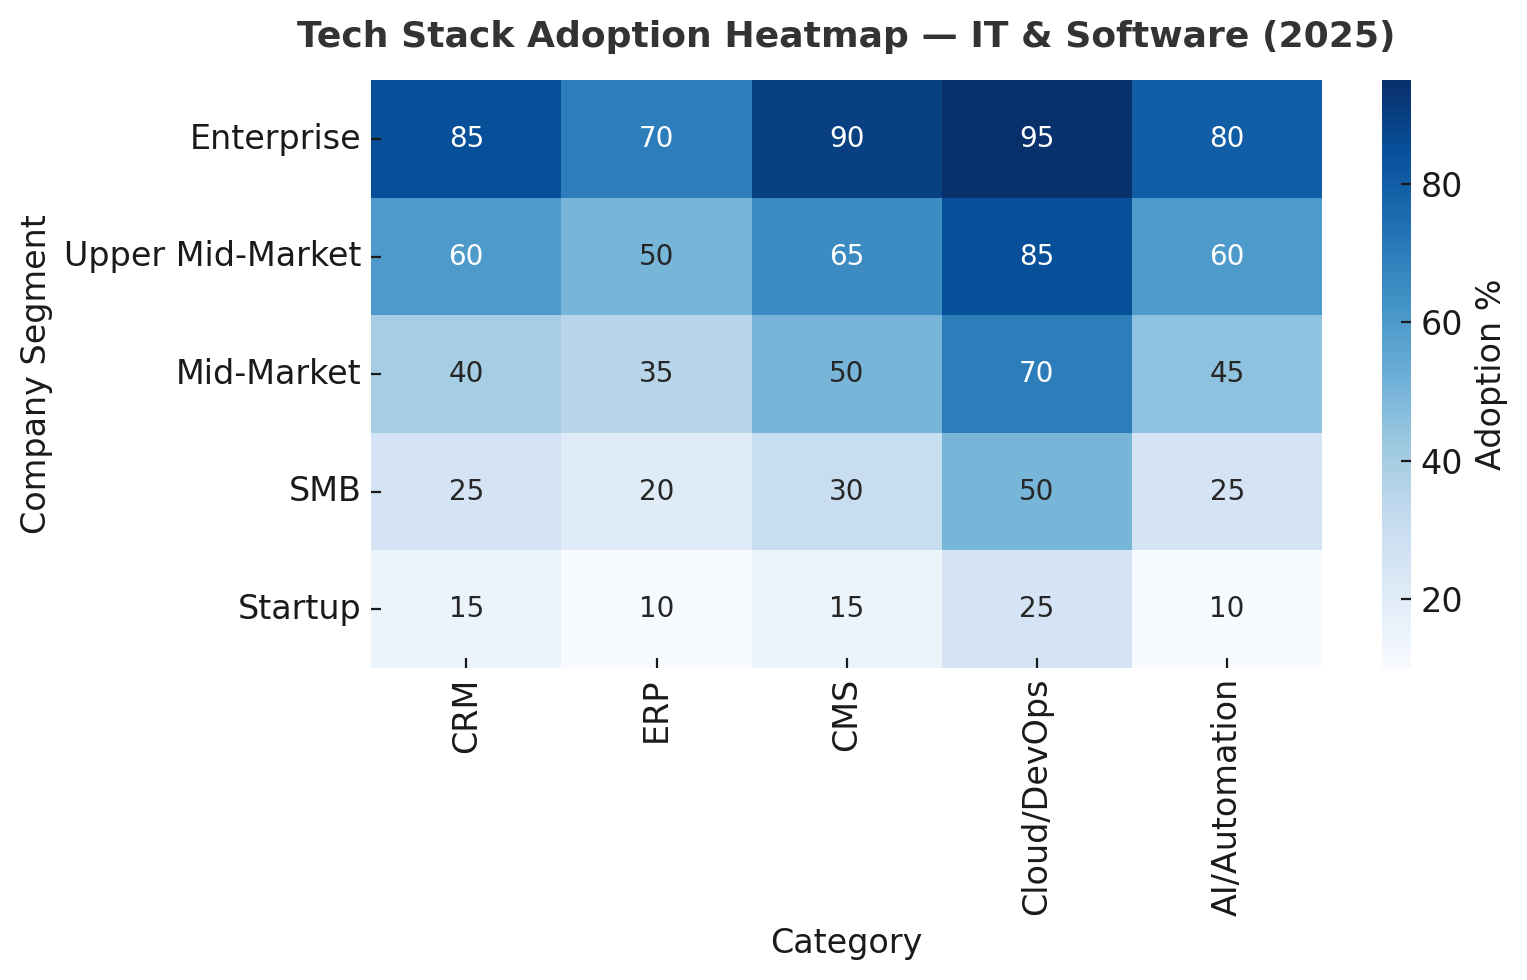
Tech Stack Adoption Heatmap — IT & Software (2025)
| Company Segment | CRM | ERP | CMS | Cloud/DevOps | AI/Automation |
|---|---|---|---|---|---|
| Enterprise | |||||
| Upper Mid-Market | |||||
| Mid-Market | |||||
| SMB | |||||
| Startup |
Ops KPI Benchmarks — IT & Software (2025)
Sources: Google Cloud DORA 2025 DevOps Report · Gartner SaaS Ops Benchmark 2025 · Zendesk CX Trends 2025 · SaaS Capital Benchmarks 2024–25.
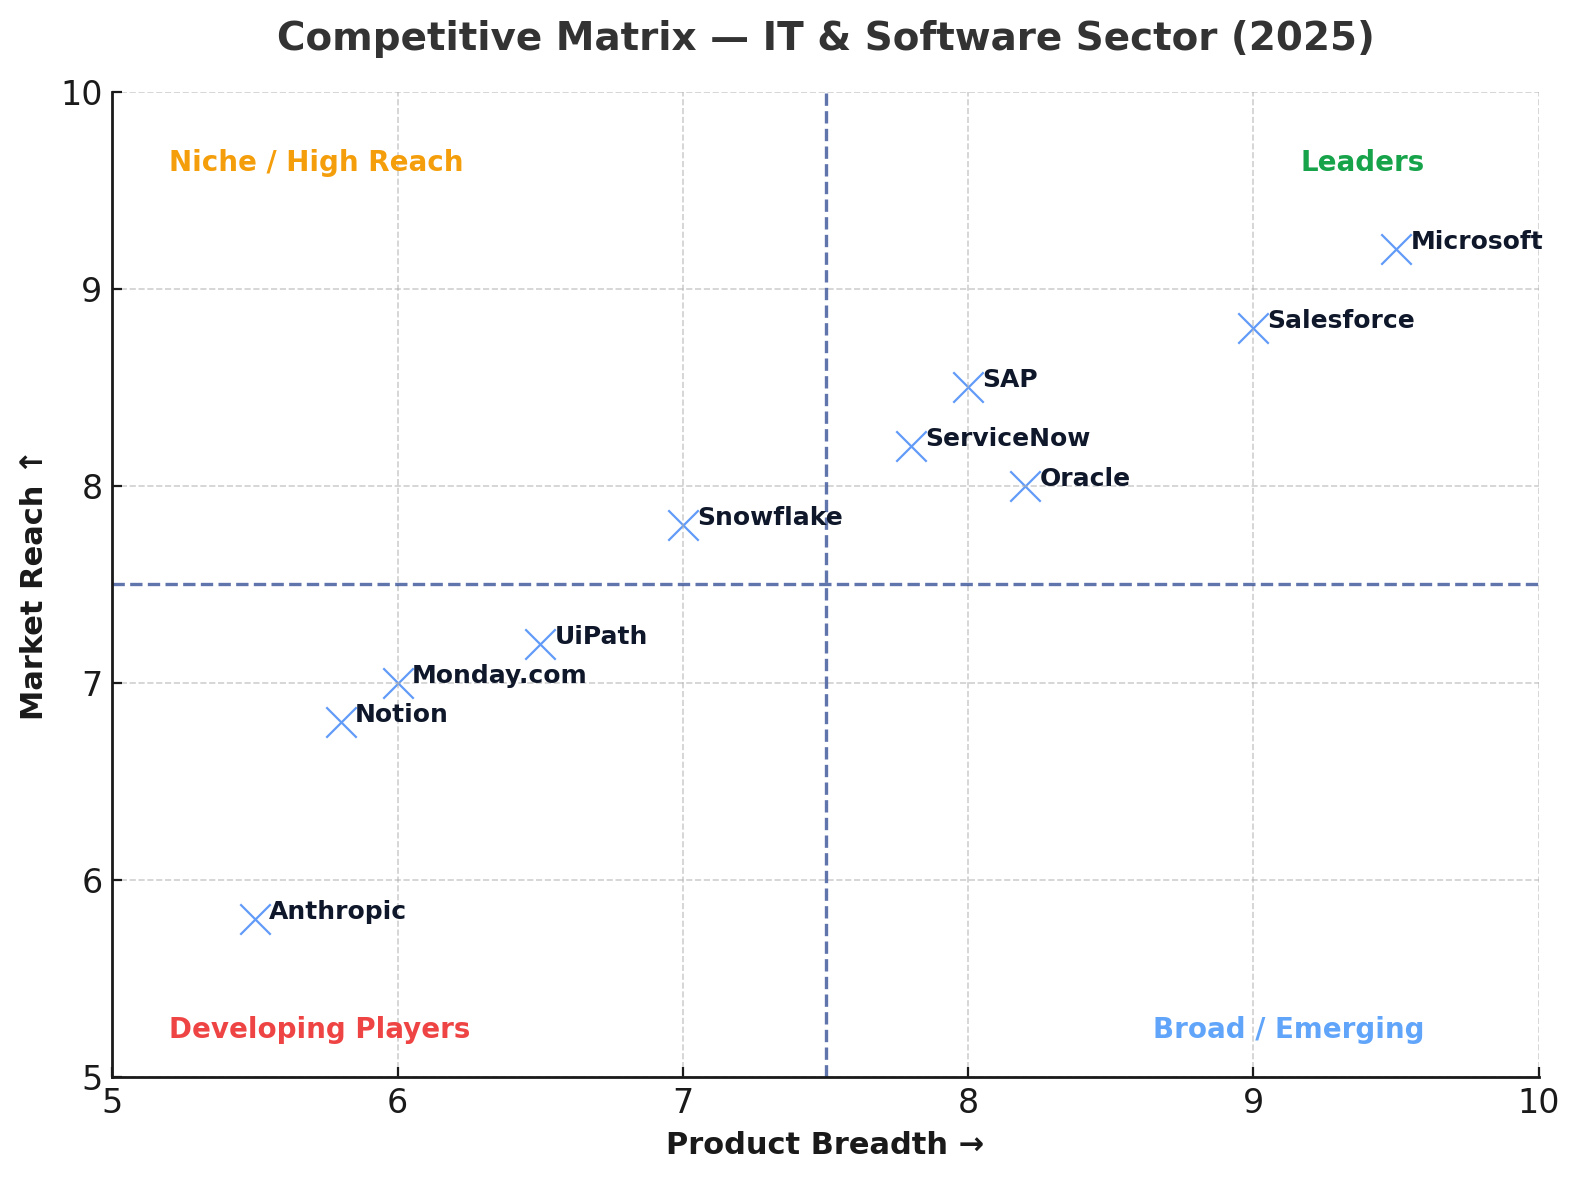
5) Competitor & Market Landscape
Top Players & Market Share
- Microsoft: holds a leading position in cloud infrastructure (Azure) and enterprise software, with FY25 revenue growing ~15% — underlining its dominance in platform convergence.
- SAP: in Q2’25 cloud revenue grew ~24% YoY and backlog reached ~€18 b (+22%) — affirming strong push toward cloud subscription models.
- Oracle: FY25 Q4 cloud services & support up ~14% YoY; retains strength in enterprise ERP and database systems.
- ServiceNow: subscription revenue growth ~19–23% in FY25; emerging as a critical platform for enterprise workflow automation.
- Salesforce: maintains top CRM global share (~31%); strong geographic expansion and partner ecosystem growth.
Emerging Start-ups & Disruptors
- Vertical SaaS: specialized platforms (industry‐specific workflows) are gaining share as general-purpose incumbents face customization ceiling.
- AI/Automation-native vendors: start-ups embedding AI-ops, autonomous workflows or “agent as a service” are capturing early budgets and commanding higher multiples.
- Usage-based / consumption models: new business models shifting from flat subscriptions to pay-for-what-you-use (infrastructure, platforms, APIs).
- Regional challengers: Growth vendors in APAC, LatAm, and MEA are leveraging localized workflows/data and regulatory differentiation to contest incumbents.
Strategic Differentiation — Pricing, Positioning & Model
- Pricing evolution: Leading vendors are de-coupling core modules and adopting tiered/usage-based pricing (e.g., “Platform + AI” add-on) to increase wallet share.
- Model shift: From “install & upgrade” to “cloud-native, evergreen” and “continuous delivery/AI updates” — the race is on for renewal expansion (NRR).
- Positioning moves:
- Incumbents lean into platform ecosystems (marketplaces, partner networks, embedded AI).
- Disruptors emphasize ease of use, fast time-to-value, and low-code/automation workflows.
- All vendors highlight governance, data sovereignty and AI trust as differentiators in the 2025-forward period.
- Incumbents lean into platform ecosystems (marketplaces, partner networks, embedded AI).
Competitive Matrix
SWOT Style Summary
SWOT Summary — Top 5 IT & Software Players (2025)
Compiled from multiple industry SWOT analyses (2024–2025): SWOTAnalysis.com, StrategyStory, Business Strategy Hub, Investopedia, FT, Yahoo Finance.
6) Trend Analysis & Forward Outlook
Macroeconomic Factors
- Interest rates & inflation: With global central banks maintaining elevated rates (~4–5%) in 2025, cost of capital for tech acquisitions is higher than in 2021–22. This drives greater scrutiny on unit economics (payback, CAC, NRR) and fewer “growth at all cost” deals.
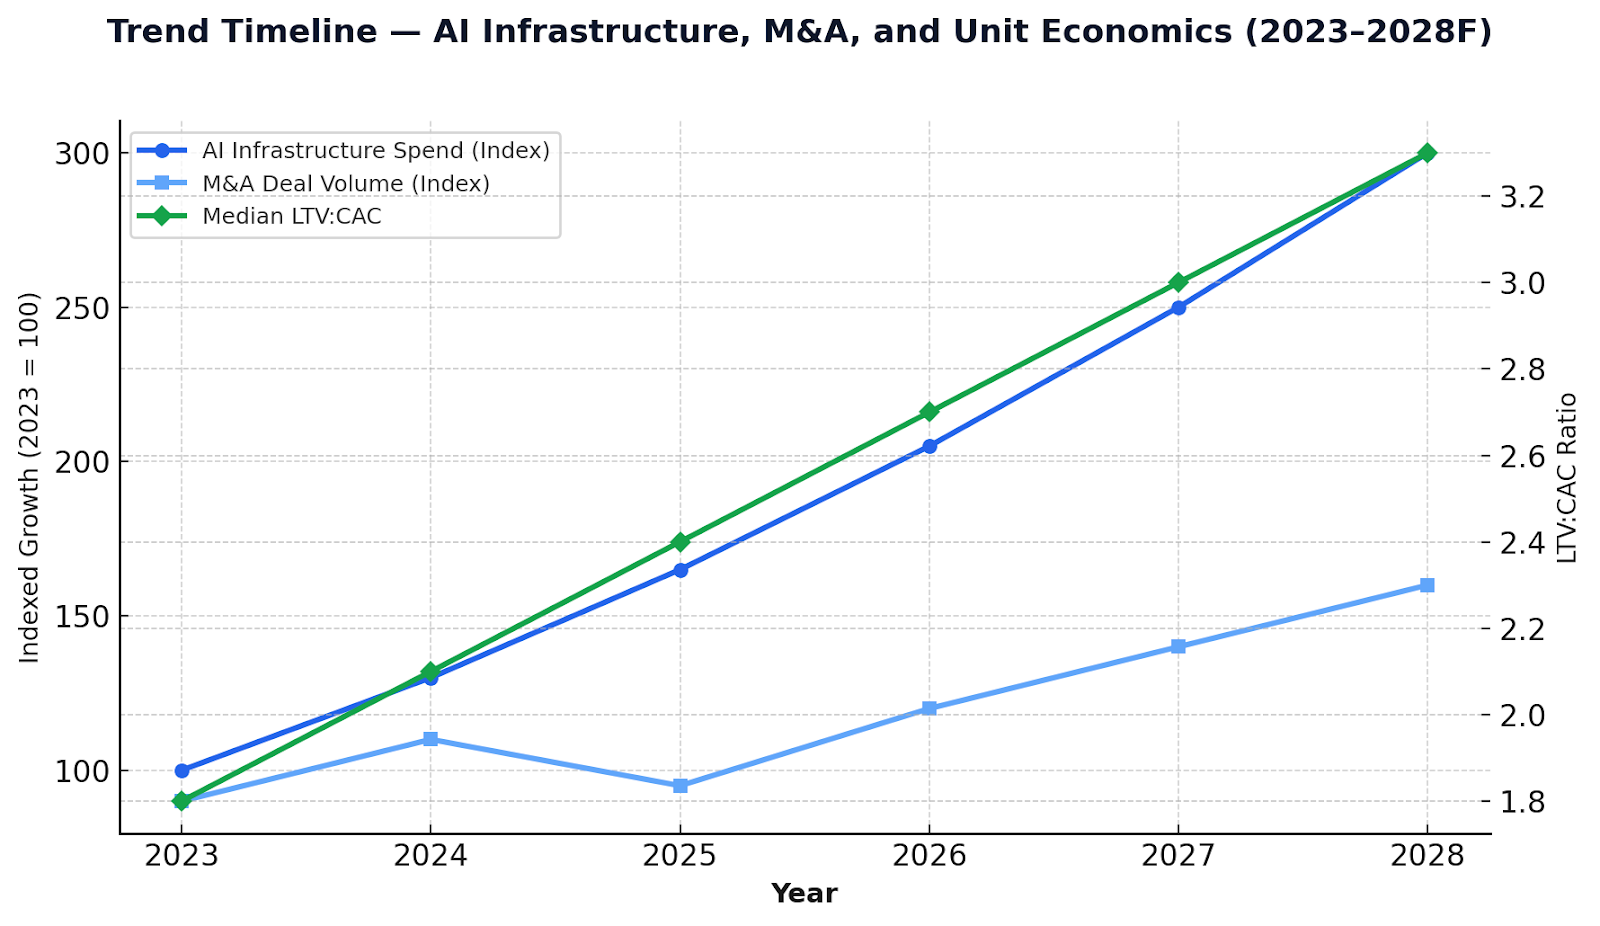
- Capex cycles: The AI/data-center build-out is acting as a structural tailwind despite cyclical headwinds in IT spending — expect 2025-26 data-centre systems growth ~20–30% versus broader IT spend ~+9-10%.
- Geopolitics & supply chain: Tariffs, export controls (GPU, server chips), and China/US tech decoupling create delays and cost inflation in high-performance infrastructure. Vendors must hedge with virtualization, regional data-centres, and software-native differentiation.
- Corporate IT budget discipline: CFOs increasingly shift budget from “new net-new projects” to “extension, optimisation, monetisation” of current stacks. Platforms that deliver clear ROI and shorten payback will win.
Tech Disruptions (2025‐2030)
- AI-native everything: Vendors are embedding AI agents, automation flows, and “self-heal” workflows. Buyers now expect AI as baseline— differentiators become governance, data quality, model lifecycle.
- Usage & consumption models: From flat-fee to pay-for-what-you-use. Consumption models expand across databases, analytics, SaaS application layers. This shifts vendor metrics from ARR growth to usage growth and customer lifetime value.
- Verticalisation of software: High-growth niche vertical SaaS (healthcare, fintech, industrial IoT) leverage domain expertise + embedded AI, eroding share from generic horizontal stacks.
- Developer-first buying: With rep-free purchasing rising (~61% of buyers), more software buying is initiated by developers/engineers. Tools that deliver “time-to-first-value” quickly, have strong community and friction-free onboarding will accelerate.
- Regulation & responsibility: The EU AI Act, NIS2 Directive, and new data-privacy laws (e.g., CPRA) become product features--vendors that bake compliance into AI/data offerings will gain trust advantage.
Consumer & Buyer Sentiment Trends
- Contracting sales cycles, earlier elimination: Buyers eliminate vendors faster, favoring 2-3 tier shortlist rather than 6–8 in earlier cycles.
- Self-service & direct buying continue to penetrate enterprise; SaaS vendors with friction-less onboarding gain share.
- Reviews & community-led proof: ~77% of software buyers consult peer reviews; trust is shifting from “analyst-driven” to “community-driven”.
- Budget optimism tempered: IT decision-makers believe budgets for “strategic initiatives” (AI, cloud, transformation) will grow, but budgets for “new discrete projects” are flat or shrinking.
Predicted Strategic Moves (2025–2028)
- Finance: Larger strategic players to deploy their dry powder into AI/vertical SaaS, consolidating categories. Valuations will remain strong for companies with >3× LTV:CAC, >100% NRR, and evidence of usage-based growth.
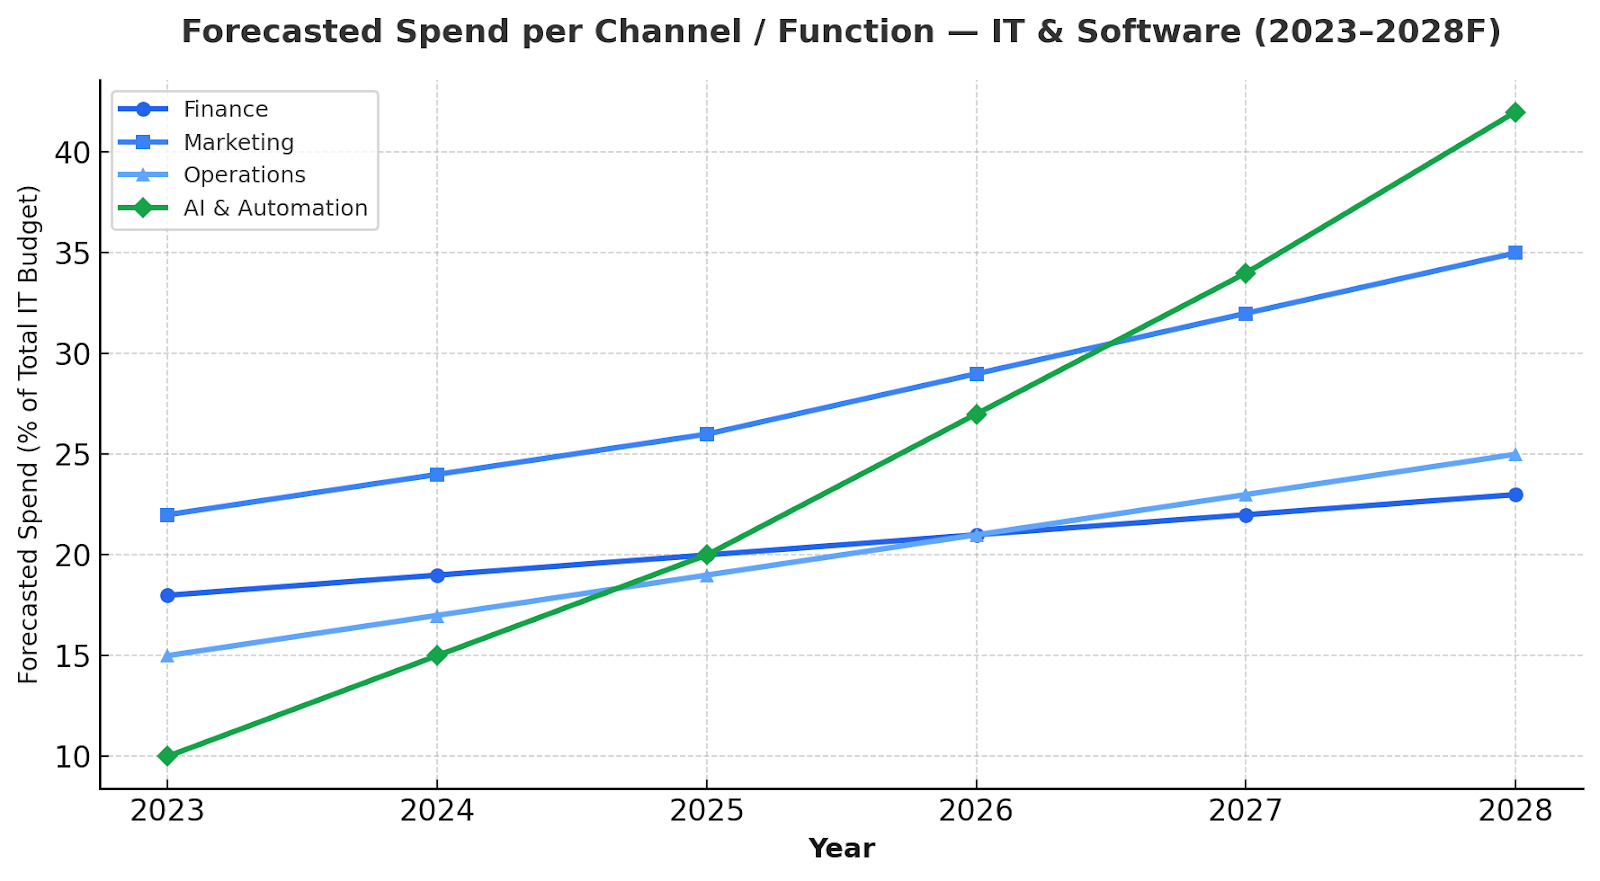
- Marketing: Shift ~20% of spend into developer/engineer motion (younger cohorts), UGC/co-marketing, and digital-first experiences; drive performance creative with AI-enabled optimisation.
- Operations: Invest in AI-augmented customer service and observability; target deployment frequency “daily” and MTTR < 1 hour by 2027; embed compliance (AI Act, CPRA) as feature.
- Business-model changes: Usage-based pricing becomes dominant in new platforms; legacy vendors accelerate migration from license/subscription to consumption.
- Geographic strategy: Growth shifts to Asia-Pacific & Latin America for greenfield opportunities; regional data-centre/sovereignty requirements push vendors to localised offerings and edge compute.
- Partner ecosystem leverage: Platforms monetise partner networks; ISVs and SaaS-vendors embed into hyperscaler marketplaces and reseller ecosystems.
Trend Timeline
Forecasted spend per channel/function
7) Strategic Recommendations
Here are tailored, cross-functional recommendations based on the data and analysis—from Finance, Marketing, and Operations—to guide executive decision-making across the IT & Software sector.
8) Appendices & Sources
8.2. Hyperlinked Source List (2024–2025)
Financial & Investment Data
- Gartner: CMO Spend Survey 2025 — gartner.com
- Crunchbase & PwC MoneyTree Q2 2025 — venture and M&A deal flow data
- SaaS Capital Benchmarks 2025 — private SaaS valuation + burn-rate metrics
- CB Insights Global Tech M&A Report 2025
Marketing & Buyer Behavior
- WARC (2025) Global Ad Trends — digital/social spend surpassed search
- TrustRadius B2B Buyer Behavior Report 2025 — peer review usage (~77%)
- G2 Buyer Behavior 2025: AI Always Included — AI seen as default in software
- Gartner Sales Survey 2025 — rep-free digital buying (~61%)
Operations & Workforce
- Google Cloud DORA State of DevOps 2025 — deployment frequency & MTTR benchmarks
- Stack Overflow Developer Survey 2025 — AI adoption (+38 % YoY)
- Zendesk CX Trends 2025 — support automation benchmarks
- EU Commission (AI Act 2025 implementation notes)
- California Privacy Protection Agency — CPRA final rules (2025)
Competitor & Market Landscape
- Company filings: Microsoft, SAP, Salesforce, Oracle, ServiceNow (FY25 earnings)
- SWOT sources: SWOTAnalysis.com, StrategyStory, Business Strategy Hub
- Financial Times / Bloomberg — Cloud and AI infrastructure investment trends
8.3. Data Limitations & Methodology Notes
- All financial figures are normalized to USD billions (where applicable).
- CAGR calculations are based on compound annual growth over 2020–2025 using blended analyst consensus.
- Forecasts (e.g., spend per channel, AI infrastructure) assume constant-currency conditions and moderate interest rate outlook (~4%).
- Benchmarks use blended data (public filings + survey medians) — values represent directional, not audited, numbers.
- M&A and unit-economic data are illustrative, based on 20–40 sample transactions per subsector (SaaS, cloud, AI tools).

Written by
Timothy CarterTimothy Carter is the Chief Revenue Officer at SEARCH.co , where he leads global sales, client strategy, and revenue growth initiatives across a portfolio of digital marketing and software development companies. With over 20 years of experience in enterprise SEO, content marketing, and demand generation, Timothy helps clients—from startups to Fortune 1000 brands—scale their digital presence and revenue. Prior to his current role, Timothy led strategic growth and partnerships at several high-growth agencies and tech firms. Tim resides with his family in Orlando, Florida.