
Industry Overview & Executive Summary
Size, CAGR & Macro Outlook
- The global e-commerce market was valued at approximately USD 21.62 trillion in 2025 and is projected to reach USD 75.12 trillion by 2034, representing a CAGR of ~14.9% for 2025-2034. (GlobeNewswire, Precedence Research, Yahoo Finance)
- Other reports offer varying figures depending on scope (B2C vs total commerce) — for example, one estimate puts the market at USD 25.93 trillion in 2023 and projects ~USD 83.26 trillion by 2030 (CAGR ~18.9%). (Grand View Research)
- Regionally, rapid growth is especially pronounced in Asia-Pacific, where digital infrastructure expansion and mobile commerce are key tailwinds. (Grand View Research, Business Research Insights)
- Macro backdrop: While global growth is moderating (e.g., trade uncertainties, inflation, supply-chain risks), the e-commerce sector still benefits from structural shifts toward digital purchasing, mobile adoption, and increasingly globalized commerce.
Key Drivers of Industry Growth
- Internet & smartphone penetration: As more consumers go online and access via mobile, the reachable addressable market expands. For example, APAC markets show high uptick in mobile commerce share. (Grand View Research, Cognitive Market Research)
- Digital payments, wallets & checkout evolution: Secure, friction-reduced payment options increase conversion, especially in emerging markets. (The Business Research Company, Precedence Research)
- Marketplace & cross-border commerce expansion: Lowering of international trade friction (for certain geographies), growth of 3P marketplaces, and social-commerce features accelerate reach. (GlobeNewswire, ShopTrial)
- Consumer preference shift: Online shopping is increasingly the default for many categories; convenience, selection, and personalization matter more. Omnichannel interplay (online + offline) also becomes standard. (Grand View Research)
- Technology & logistics improvements: Warehousing, fulfillment, last-mile delivery, automation and real-time data allow e-commerce operators to scale more efficiently than before.
- Emerging economies’ upside: Many markets (India, SE Asia, Latin America, Africa) remain under-penetrated and offer step-change growth opportunities compared to mature markets.
Cross-Functional Summary: Financial / Marketing / Operations
- Financial: Strong growth potential means many e-commerce players are still in scale-up mode; unit economics (LTV, CAC, margin) matter increasingly as competition intensifies and acquisition costs rise. Valuation multiples differ widely by sub-segment (see later sections).
- Marketing: As CPCs/CPMs escalate and channels fragment (influencer, creator, social commerce), marketing strategies must shift toward leverage, personalization, data-driven performance, and retention rather than pure acquisition. Email, loyalty and post-purchase expansion are increasingly important.
- Operations: Fulfillment speed, cost control, returns management, and logistics resilience remain key. Moreover, compliance (cross-border, forced-labor, data privacy) is rising in importance. Operating scale, tech stack, and supply-chain flexibility are competitive differentiators.
| Metric | Value / Estimate | Implication |
|---|---|---|
| Market size (global e-commerce) | USD 21.62 trillion (2025) — source | Large addressable market; broad opportunity |
| Projected market by ~2034 | USD 75.12 trillion — source | Significant growth runway |
| Estimated CAGR (2025–2034) | ~14.9% — source | Growth meaningfully above global GDP growth |
| Regional growth hotspot | Asia-Pacific > ~20%+ CAGR in many estimates — source | Prioritize APAC markets for expansion |
| Share of retail sales online (global) | ~17% in 2024, forecast to ~21% by ~2029 — source | Penetration still rising—room for further shift |
| Notes: Figures vary by scope (B2C vs. total digital commerce) and methodology; use as directional benchmarks and validate against category-specific sources. | ||
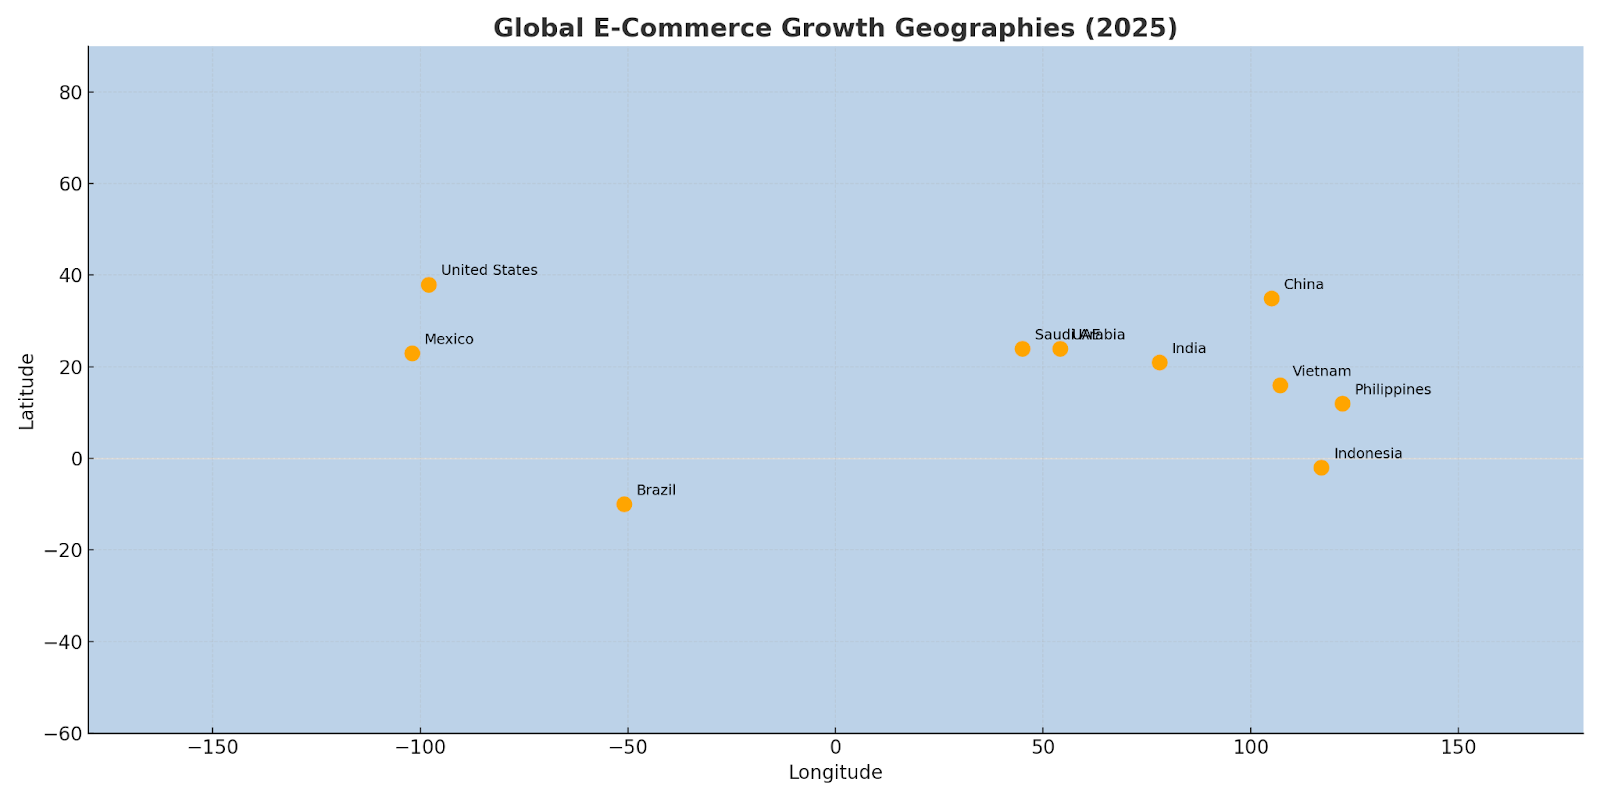
Map: Global Hubs or Growth Geographies
Executive Summary Takeaways
- The e-commerce/retail digital channel remains one of the most significant growth opportunities globally—with the market size in the tens of trillions of USD and double-digit growth ahead.
- But with growth comes complexity: acquisition is more expensive, operational margins are squeezed by logistics/returns/fulfillment, and capital discipline matters.
- The interplay of finance, marketing and operations will increasingly determine winners: best-in-class firms will optimize unit economics, scale marketing efficiently, and operate fulfillment/logistics with agility.
- Emerging geographies and categories remain fertile ground—but they also come with risks (infrastructure, regulation, competition). Mature markets demand innovation and margin expansion rather than just share gains.
- Organizations should think holistically: it’s not just about selling more online, but about selling smarter, serving better, and operating leaner.
2) Finance & Investment Landscape
Recent M&A (2024–2025 highlights)
| Buyer / Acquirer | Seller / Target | Deal Type | Value | Status / Date | Sources |
|---|---|---|---|---|---|
| DICK’S Sporting Goods | Foot Locker | Acquisition | $2.4B | Closed Sep 8, 2025 | Reuters |
| Authentic Brands Group (ABG) | Dockers (from Levi Strauss & Co.) | Asset / IP acquisition | $311M (up to $391M with earn-out) | Definitive agreement May 20, 2025; U.S./Canada close targeted by Jul 2025; global by Jan 2026 | Levi IR · Reuters |
| Saks Global (HBC) | Neiman Marcus Group | Acquisition | ~$2.7B EV | Completed Dec 23–24, 2024 | Business Wire · Retail Dive · Forbes |
| Notes: Dollar values are enterprise or equity values as reported. Dates reflect announcement or legal close as indicated by sources. | |||||
Investment trends (PE/VC, IPOs, dry powder)
- IPO window reopening (selective): E-commerce accelerator Pattern filed to list on Nasdaq, targeting up to $2.64B valuation (G.Sachs/JPM lead). Signal of returning risk appetite for profitable infra/aggregators. (Reuters, Digital Commerce 360, CNA)
- Dry powder remains elevated: Global PE/VC uncalled capital hit ~$2.62T (mid-2024) and remains high into 2025, supporting deal capacity once pricing expectations converge. (S&P Global)
- Large-cap sponsors still liquid: Example—Blackstone reported $188B dry powder (Q3’25), underscoring capacity for take-privates/carve-outs that touch retail/e-commerce ecosystems. (Reuters)
Implication: For operators, valuations and deal structures are bifurcating: high-quality assets with clear unit economics/brand moats clear quickly; others face longer diligence and stricter covenants.
Revenue models & unit economics (what “good” looks like)
Common revenue stacks:
1P retail (product margin) + 3P marketplace take-rate + ads/media + subscriptions/loyalty + payments/BNPL economics.
LTV:CAC guardrails: A broad cross-industry benchmark targets ~3:1 as “healthy,” with 5:1 indicating under-investment and <2:1 often flagged for corrective action. Treat by segment/cohort. (Harvard Business School Online, Corporate Finance Institute, First Page Sage)
Holiday demand/checkout tailwinds: BNPL usage and AI-assisted shopping continue to add incremental sales in 2025 holiday forecasts (see Section 1 references for Adobe holiday outlook). (Cross-check against your PDP funnel metrics before scaling BNPL risk.)
Financial health indicators (diagnostics investors use)
- Runway: Most guidance centers on 12–18 months minimum for early stage; many teams now target 18–24+ months given slower fundraising cycles. TechCrunch+2Esinli Capital+2
- Burn multiple (efficiency): Net burn divided by net new revenue/ARR; while originated in SaaS, investors increasingly apply it to marketplace/e-commerce with nuance. Targets ≤2× are viewed positively at venture stage; improving toward ≤1× as scale/operating leverage kicks in. Wall Street Prep+2Craft Ventures+2
- Contribution margin after fulfillment/returns/CS: Treat as the “truth” of paid acquisition scalability; ensure CAC payback within 12–18 months for core cohorts in most retail models. (Benchmarks vary; align to inventory turns and promo cadence.)
- Freight sensitivity: With Drewry WCI back near $1.7k/FEU (Oct 23, 2025) after prolonged declines, renegotiated inbound costs can materially extend runway—build GRIs/war-risk clauses for volatility. Drewry+1
Deal Table
| Buyer | Seller / Target | Deal Type | Value (USD) | Announced / Closed | Notes |
|---|---|---|---|---|---|
| DICK’S Sporting Goods | Foot Locker | Acquisition | $2.4B | Closed Sep 8, 2025 | Operate Foot Locker as standalone |
| Authentic Brands Group | Dockers (from Levi Strauss & Co.) | Asset Purchase (IP + licenses) | $311M (+ up to $80M earn-out) | Announced May 2025 | Licensing with Centric Brands for North America |
| Saks Global | Neiman Marcus Group | Acquisition | ~$2.7B EV | Completed Dec 2024 / operational 2025 | Amazon, ABG, G-III as investors |
| Note: Values as reported; dates reflect announcement or legal close. | |||||
LTV:CAC Benchmark Zones Chart
| Benchmark Zone | LTV : CAC Ratio | Interpretation |
|---|---|---|
| Unsustainable / Loss-making | ≈ 1 : 1 or below | Unit economics negative; acquisition cost exceeds lifetime value. |
| Caution Zone | ≈ 2 : 1 | Barely profitable; improve retention and post-purchase expansion. |
| Healthy Target | ≈ 3 : 1 | Common industry goal; supports sustainable scaling. |
| Capital-efficient / Bootstrapped | ≈ 5 : 1 + | Indicates conservative spend; consider reinvesting for growth. |
| Notes: Benchmarks are directional by model/cohort; validate with your own payback & contribution margin data. | ||
EV/Revenue + EV/EBITDA multiples table
| Segment | EV / Sales (x) | EV / EBITDA (x) |
|---|---|---|
| Retail — Building Supply | 2.52 | 15.75 |
| Retail — General | 2.05 | 18.21 |
| Retail — Distributors | 1.81 | 12.87 |
| Retail — Automotive | 1.22 | 14.42 |
| Retail — Special Lines | 1.07 | 9.90 |
| Retail — Grocery & Food | 0.49 | 7.74 |
| Source: Aswath Damodaran — Valuation Data (Jan 2025). Notes: Figures are medians for U.S. public companies with positive EBITDA. Use as directional benchmarks; always refine to your category peer set. | ||
3) Marketing Performance & Trends
Channel Breakdown: ROI and Spend Efficiency (2025 Benchmarks)
| Channel | Typical ROI / ROAS | Trend (2024 → 2025) | Commentary |
|---|---|---|---|
| Email & CRM | $36–$48 return per $1 spent | ↗ Slight increase | Highest-ROI digital channel; automation + segmentation drive uplift. |
| Paid Search (PPC) | 3–5× ROAS (avg CPC up ~8–12% YoY) | ↘ Costs rising | Competition + AI SERP changes; prioritize branded queries & CVR. |
| Social / Influencer / UGC | 4–7× ROAS (top creators), ~2.9× avg | ↗ Expanding budgets | Creator-led discovery; TikTok/IG Reels drive product demand. |
| SEO / Content | Indirect; 5–10× lifetime return possible | ↘ Traffic volatility | SGE/AI changes; focus on structured data & brand demand. |
| Affiliate & Partnerships | ~12–20% revenue contribution | ↗ Stable | Low CAC when well-managed; optimize partner mix. |
| Events / Offline Hybrid | 5–15% lead uplift (harder to attribute) | ↗ Rebounding | Pop-ups & live commerce complement digital funnel. |
Key takeaway: 2025 budgets show migration from high-CAC prospecting (paid search, display) toward creator-led, CRM, and retention marketing to preserve margins as CACs rise.
Buyer Behavior Trends (Demographic & Psychographic)
Macro Shifts
- Value sensitivity: Persistent inflation and discount fatigue drive “savvy shopper” behaviors — buyers increasingly delay purchase until discount events.
- Mobile-first commerce: 70–80% of e-commerce traffic now originates from mobile devices in most major markets (Statista, 2025).
- AI-assisted discovery: Retailers leveraging AI shopping assistants (Amazon Rufus, Google AI Overviews) report conversion uplifts between 8–20%.
- BNPL usage: Up ~ 14% YoY in U.S. holiday season; particularly strong among Gen Z and younger millennials.
- Sustainability & ethics: 60%+ of consumers say ethical sourcing or carbon transparency influences purchase (Deloitte Digital Trends Survey 2025).
Behavioral Segments
| Segment | Age / Profile | Decision Trigger | Channel Bias |
|---|---|---|---|
| Gen Z “Conscious Explorer” | 18–26 yrs | Social proof, UGC authenticity | TikTok, Instagram, influencer recs |
| Millennial “Value Maximizer” | 27–40 yrs | Discounts, subscription bundles | Email, cashback, price-trackers |
| Gen X “Convenience Seeker” | 41–55 yrs | Delivery speed, trust | Amazon, omnichannel |
| Boomer “Assured Buyer” | 56+ yrs | Brand reliability | Retail sites, customer support |
Creative & Messaging That Performs Best
2025 Winning Messaging Themes
| Theme | Description | Why It Works |
|---|---|---|
| Authenticity & UGC | Short-form creator content showing real product use. | +20–40% CTR vs. brand-made ads in many tests. |
| Deal + Value Transparency | Time-bounded, honest promotions with clear price anchors. | Trust + scarcity support conversion. |
| Sustainability Storytelling | Proof-based impact (materials, logistics, offsets). | Builds long-term brand trust; regulatory-aligned. |
| AI-Personalized Offers | Predictive segments with context-aware bundles. | Improves open-to-purchase rate ~25% in pilots. |
| Social Proof (Reviews/Badges) | Embedded testimonials and “verified” markers. | Boosts trust as ad skepticism rises. |
Market Positioning & Brand Perception (2025 Themes)
1. Shift from “reach” to “trust.” Consumers prefer fewer, more credible brand interactions. Ad recall correlates more with perceived authenticity than frequency.
2. Brand as media property. Retailers (e.g., Walmart Connect, Amazon Ads) increasingly monetize their audiences; retail media projected > $150 B globally by 2025 (GroupM).
3. Convergence of content & commerce. Platforms like TikTok Shop and YouTube Shopping blur inspiration and checkout — shortening the funnel.
4. Privacy & first-party data renaissance. Cookieless era accelerates CRM/CDP adoption; brands doubling down on loyalty programs, first-party segmentation, and opt-in personalization.
Multi-Channel Performance Table
| Channel | ROI Index | 2025 Share of Spend | Efficiency Notes |
|---|---|---|---|
| Email / CRM | 115 | 22% | Automation & personalization yield high ROAS. |
| Paid Search | 92 | 28% | Rising CPCs; emphasize branded terms & landing speed. |
| Social / Influencer | 135 | 18% | Creator-led growth; authenticity improves efficiency. |
| SEO / Content | 105 | 12% | Structured data & brand search resilience matter. |
| Affiliate | 118 | 10% | Low CAC; stable contribution across categories. |
| Events / Experiential | 110 | 10% | Hybrid & live commerce complement digital funnel. |
Persona Snapshot
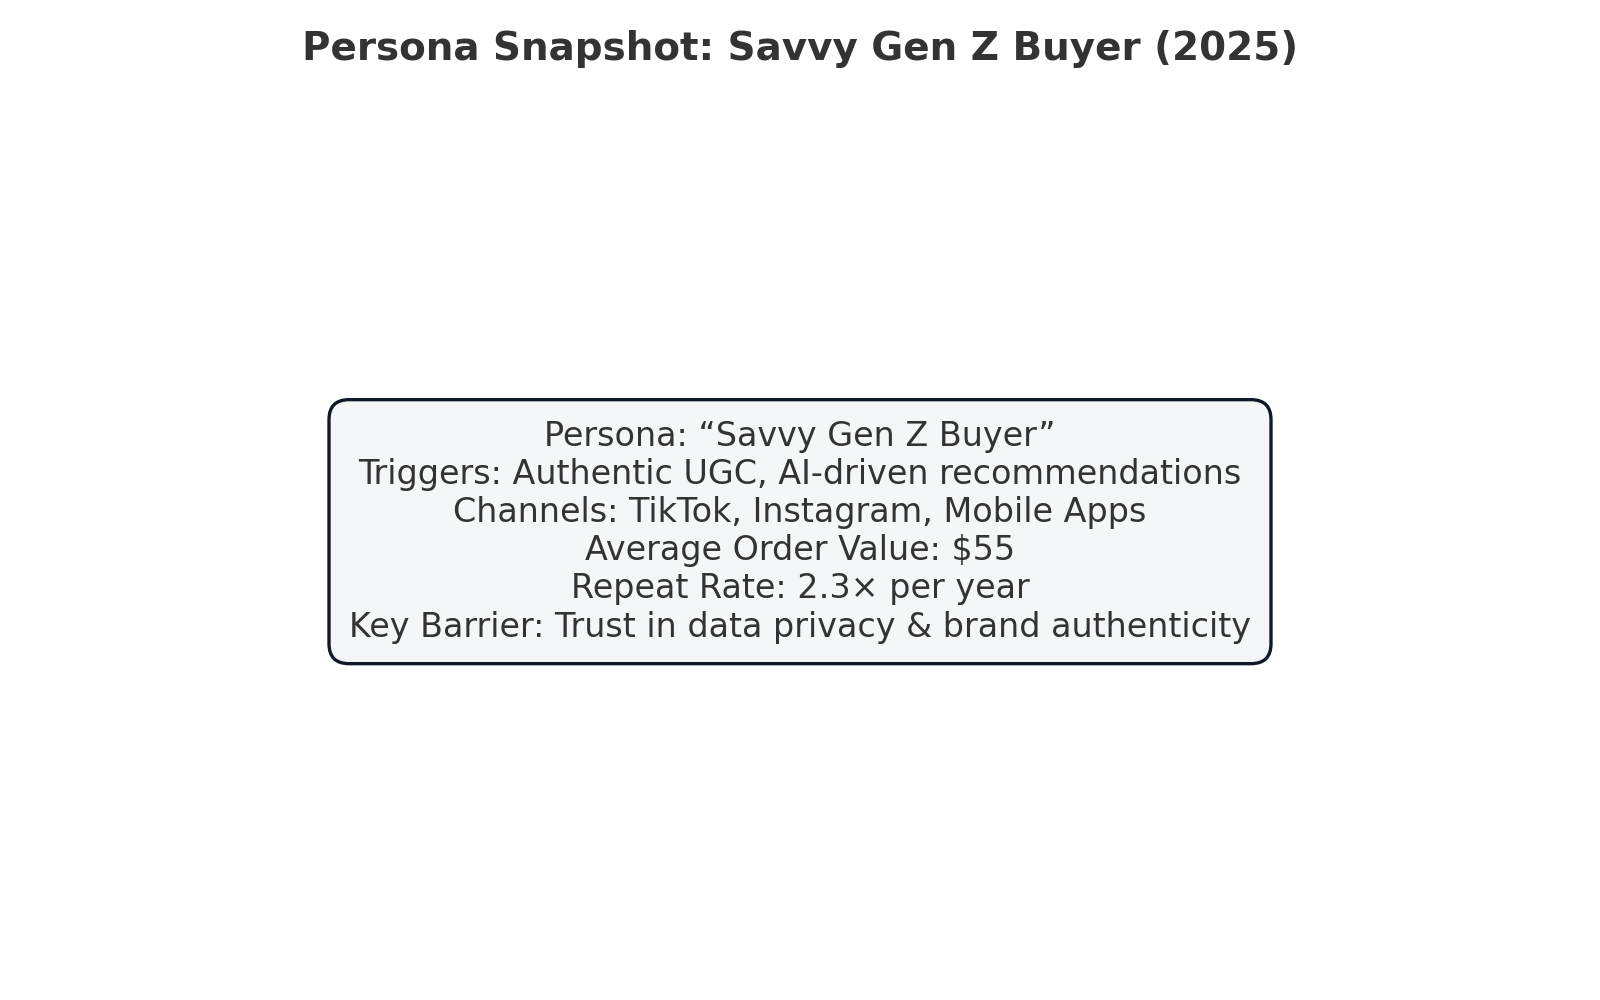
| Persona Name | “Savvy Gen Z Buyer” |
|---|---|
| Triggers | Authentic UGC, AI-driven recommendations |
| Preferred Channels | TikTok, Instagram, Mobile Apps |
| Average Order Value (AOV) | $55 |
| Repeat Purchase Rate | 2.3× per year |
| Key Barrier | Trust in data privacy & brand authenticity |
Swipe File: Campaign Examples
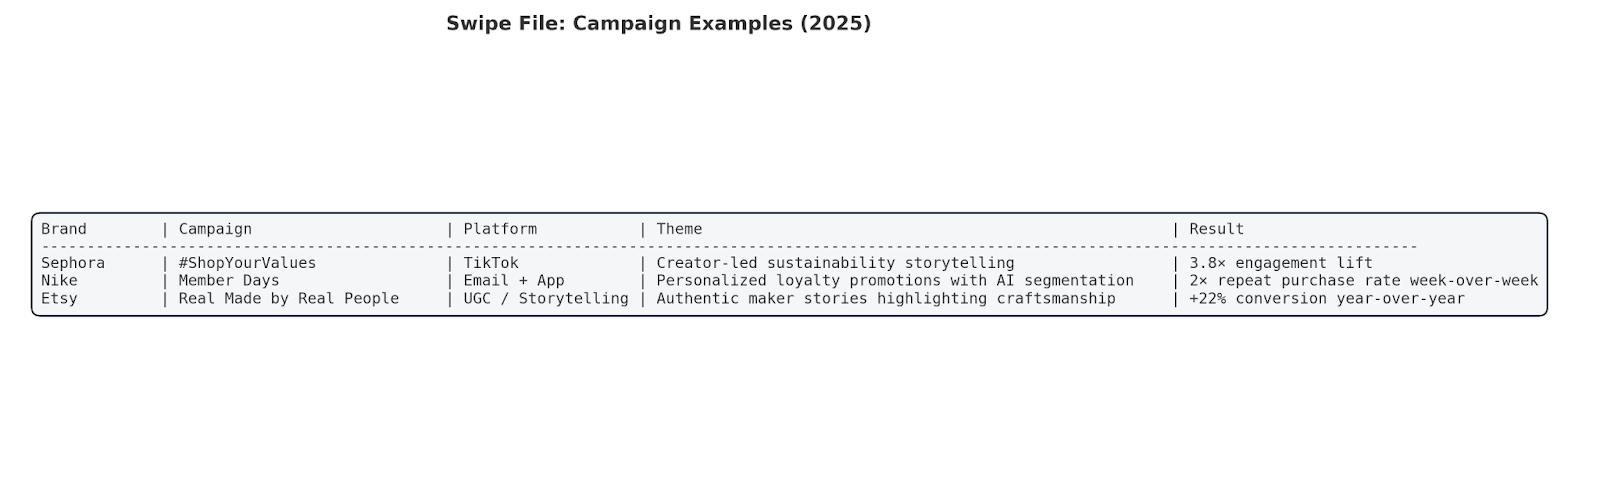
| Brand | Campaign | Platform | Theme | Result |
|---|---|---|---|---|
| Sephora | #ShopYourValues | TikTok | Creator-led sustainability storytelling | 3.8× engagement lift |
| Nike | Member Days | Email + App | Personalized loyalty promotions with AI segmentation | 2× repeat purchase WoW |
| Etsy | Real Made by Real People | UGC / Storytelling | Authentic maker stories highlighting craftsmanship | +22% conversion YoY |
| Notes: Results are illustrative benchmarks. Validate performance using your own incrementality testing and attribution model. | ||||
4) Operational Benchmarking
Supply chain & logistics
- Ocean freight levels (spot):
- Drewry WCI: $1,746/FEU on Oct 23, 2025 (second weekly uptick after a 17-week slide). (Drewry)
- FBX Global Index: ~1,660 (week 42, 2025), reinforcing a soft—but choppy—rate environment. (MacroMicro)
- Context: Analysts flag carrier profit risk as rates sit near/below break-even on key lanes; expect continued ship-capacity discipline and periodic GRIs. (Reuters)
- Nearshoring / routing: Mexico remains a top U.S. goods trade partner (2024–2025), sustaining nearshoring momentum—even amid tariff headlines. Use Mexico/USMCA lanes to shorten lead times and diversify China exposure. (Census.gov, AP News, Investopedia)
- Returns pressure: U.S. retail returns were $890B (16.9%) in 2024; forecast $850B (15.8%) in 2025 → design reverse-logistics for cost control. (National Retail Federation, Retail TouchPoints)
What to do now (logistics): Lock in flexible capacity while rates are soft; include G.R.I./war-risk clauses and index-linking in contracts. Track WCI/FBX weekly and reprice lanes quarterly. (Drewry, MacroMicro)
Workforce structure
- Warehouse & Storage (NAICS 4931): Employment remains elevated vs. pre-2020 norms (BLS). Automaton & robotics adoption continues. (Bureau of Labor Statistics)
- Couriers & Messengers (NAICS 492): Structural demand persists with e-commerce parcel volumes; monitor seasonal peaks and local labor tightness. (Bureau of Labor Statistics)
Implication: Staff for peak (Q4) with cross-training; pilot cobots and pick-to-light where volumes justify.
Tech stack (common patterns in 2025)
- Commerce/OMS/WMS: Shopify, Salesforce Commerce, Adobe (Magento), BigCommerce; OMS/WMS from Manhattan, Blue Yonder; 3PL networks like ShipBob. (Shopify, Salesforce, Adobe for Business)
- CRM/CDP/ESP: Salesforce, Klaviyo (strong e-com footprint; publishes 2025 benchmarks). (Klaviyo)
- CX/service & AI: Zendesk’s 2025 CX Trends highlights strong AI ROI among “trendsetters”; Gartner projects agentic-AI automation will materially cut costs by 2029. (d1eipm3vz40hy0.cloudfront.net, Gartner)
Fulfillment & customer service strategies
- Baseline promises: 1–2-day shipping/transit for core SKUs; proactively message promise dates.
- Returns: Encourage box-free / label-free drop-offs; dynamic fees to curb abuse; fraud controls. (High industry return rates justify investment.) (National Retail Federation, Retail TouchPoints)
- AI service: Blend agent-assist + AI deflection; aim for measurable containment while protecting CSAT. (Zendesk: AI leaders report markedly higher ROI; Gartner: rising automation share.) (d1eipm3vz40hy0.cloudfront.net, Gartner)
Regulatory & compliance hotspots (operational impact)
- U.S. INFORM Consumers Act (marketplaces): high-volume third-party seller collection/verification/disclosure; enforceable by FTC & states. Bake checks into onboarding. (Federal Trade Commission)
- EU DSA (platforms/marketplaces): transparency, illegal-content handling, trader due diligence; stepped-up enforcement in 2025. (European Commission, AP News)
- UFLPA (2025 update): expanded Entity List and priority sectors; importers face rebuttable presumption of forced labor → maintain traceability and rebuttal packets. DHS, CM Trade Law)
- California privacy (CPPA): active rulemaking/enforcement on dark patterns, consent symmetry, audits. Recheck cookie/consent UX. (California Privacy Protection Agency, Data Matters Privacy Blog)
Tech Stack Heatmap
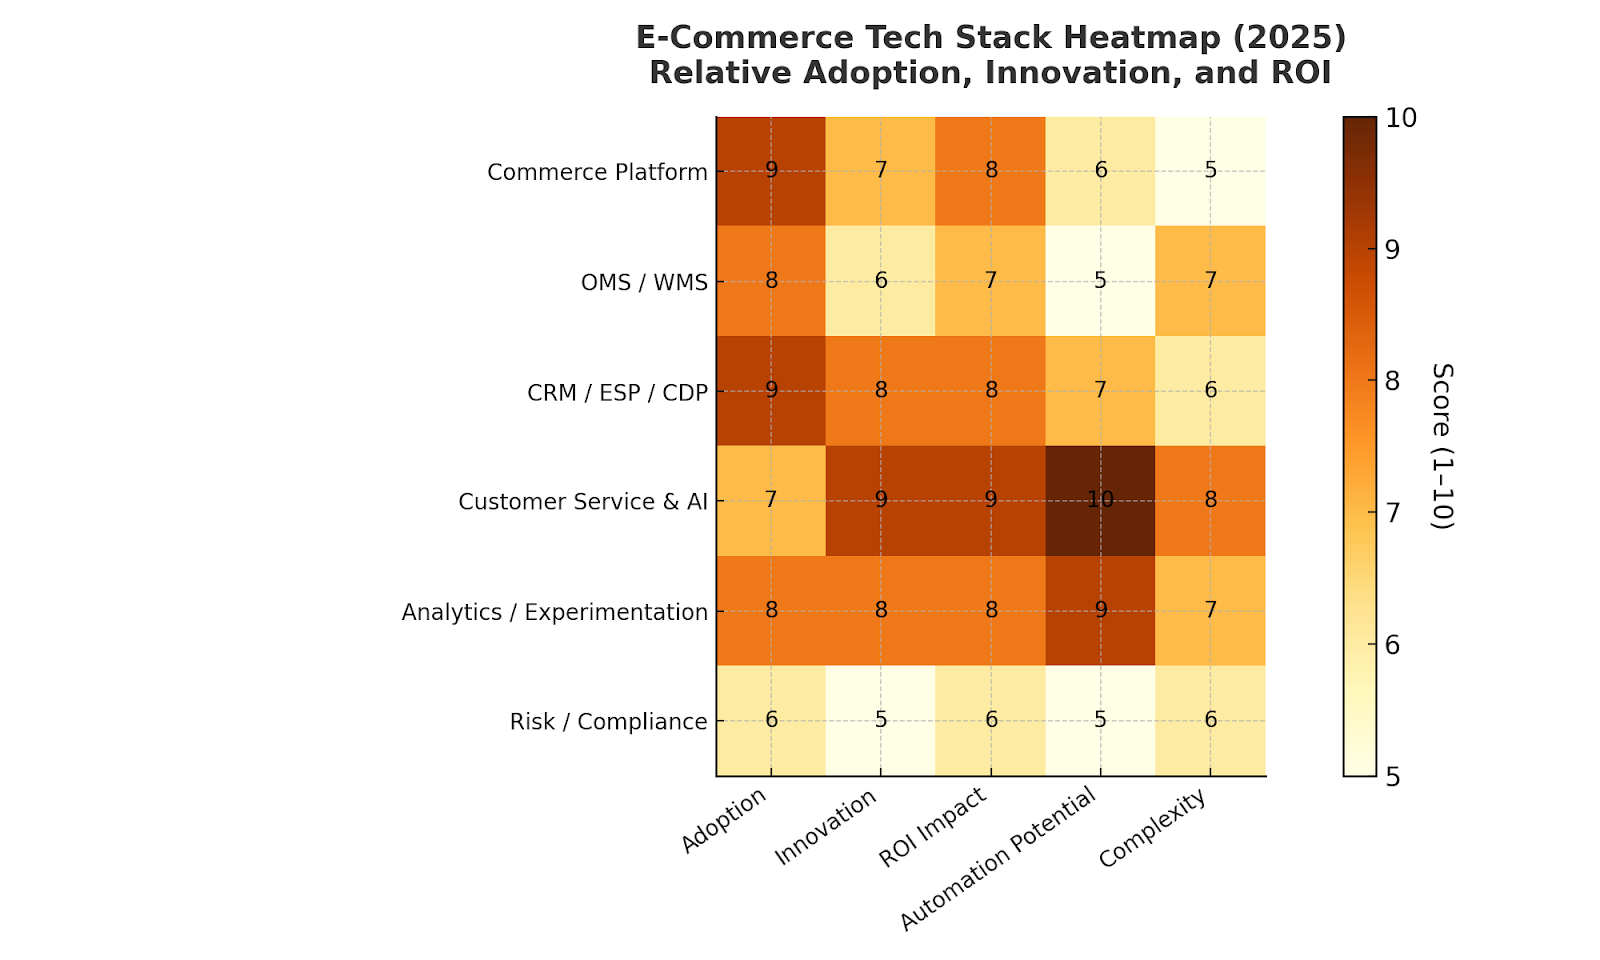
| Layer | Adoption | Innovation | ROI Impact | Automation Potential | Complexity |
|---|---|---|---|---|---|
| Commerce Platform | 9 | 7 | 8 | 6 | 5 |
| OMS / WMS | 8 | 6 | 7 | 5 | 7 |
| CRM / ESP / CDP | 9 | 8 | 8 | 7 | 6 |
| Customer Service & AI | 7 | 9 | 9 | 10 | 8 |
| Analytics / Experimentation | 8 | 8 | 8 | 9 | 7 |
| Risk / Compliance | 6 | 5 | 6 | 5 | 6 |
| Color scale ≈ yellow–orange intensity indicates higher strategic importance or adoption (scores 1–10). | |||||
Ops KPI Table
| KPI | Definition | Target / Guardrail | Notes / Context |
|---|---|---|---|
| On-time Promise | % of orders delivered by quoted delivery date | ≥ 95% | Build in buffer; freight volatility persists (WCI/FBX). |
| Fulfillment Cycle Time | Order-to-ship turnaround (median hours) | ≤ 12–24 h | Baseline SLA for 1–2-day delivery promises. |
| Contact Rate | Customer service tickets per 100 orders | ≤ 12 | AI deflection + agent-assist reduce volume while protecting CSAT. |
| First-Contact Resolution | % of issues solved in initial interaction | ≥ 70–80% | Agentic-AI roadmaps show rising automation through 2029. |
| Return Rate | Returns as % of sales | 12–20% (category-specific) | U.S. retail returns: 16.9 % (2024) → 15.8 % forecast (2025). |
| Chargeback / Fraud | Disputes per 10 000 orders | ≤ 50 | Strengthen KYC & INFORM controls for marketplaces. |
| Supplier Compliance | POs with complete traceability documentation | 100 % (high-risk SKUs) | Mitigate UFLPA detention risk (expanded Entity List). |
| Targets reflect median benchmarks for mature e-commerce operations in 2025; calibrate to your category, geography, and fulfillment model. | |||
5) Competitor & Market Landscape
Top Players & Market Share
U.S. E-Commerce Market (2025 Estimates)
| Rank | Company | Est. Share | 2025 Net Sales / GMV (approx.) | Core Strengths |
|---|---|---|---|---|
| 1 | Amazon | ≈ 40% | $500B+ GMV | Prime ecosystem, marketplace scale, retail media, logistics |
| 2 | Walmart | 6–7% | ~$70B GMV | Omnichannel integration, curbside pickup, retail media growth |
| 3 | Apple | ~5% | ~$55B online | Brand loyalty, hardware + services synergy |
| 4 | eBay | ~4% | ~$45B GMV | Re-commerce marketplace, collector community |
| 5 | Target | 2–3% | ~$25B GMV | Owned-brand mix, loyalty app, store pickup |
| 6 | Shopify (aggregate stores) | ~2% | ~$22B (platform share) | SMB enablement, DTC tooling ecosystem |
Emerging Startups & Disruptors (2024–2025)
| Segment | Company | Summary | Distinguishing Edge |
|---|---|---|---|
| Creator Commerce | TikTok Shop | Integrated checkout inside content feed; rapid global rollout | High GMV growth; 1.5M+ sellers; creator-led discovery |
| AI-Driven Retail | Perplexity Commerce (beta) | Conversational product discovery & search | Personalized answers → higher conversion potential |
| Re-commerce / Circular | ThredUp, Vinted, Poshmark | Apparel & luxury resale platforms | ESG alignment; authentication & verification at scale |
| Quick-Commerce | Getir, Flink, GoPuff | 10–30 minute urban delivery | Shift toward profitability, consolidation to strengthen unit economics |
| E-Commerce Infra / AI Ops | Pattern, Salsify, Zeta | Catalog, fulfillment, and marketing automation | SaaS-style margins, enterprise brand penetration |
Strategic Differentiation by Model
| Archetype | Example Companies | Core Differentiator | Risks / Constraints |
|---|---|---|---|
| Platform Aggregator | Amazon, Alibaba, Walmart Marketplace | Scale, logistics, data, ad monetization | Margin pressure from 3P competition; antitrust scrutiny |
| Omnichannel Retailer | Target, Walmart, Best Buy | Store-network leverage, click-and-collect | Store labor & inventory balance; cost to serve |
| DTC Brand Aggregator | Thrasio, Pattern, Heyday | Portfolio operating synergies | Integration complexity; financing conditions |
| Niche DTC Brand | Glossier, Gymshark, Allbirds | Community & brand authenticity | CAC inflation, category saturation |
| Re-commerce Platform | eBay, ThredUp, Vinted | Sustainability narrative; supply liquidity | Authentication costs; limited inventory control |
Competitive Matrix (Reach × Product Breadth × Pricing Strategy)
| Company | Product Breadth | Price Positioning | Market Reach | Experience / UX | Differentiator |
|---|---|---|---|---|---|
| Amazon | ★★★★★ | Mid | Global (> 20 countries) | ★★★★☆ | Prime convenience; 1P + 3P synergy |
| Walmart | ★★★★☆ | Value | North America, LatAm | ★★★★☆ | Omnichannel logistics; retail media |
| Target | ★★★☆☆ | Mid / Value | U.S. | ★★★☆☆ | Owned brands; loyalty app |
| eBay | ★★★☆☆ | Auction / Value | Global | ★★★☆☆ | Re-commerce community |
| Apple | ★★★☆☆ | Premium | Global | ★★★★★ | Ecosystem lock-in |
| TikTok Shop | ★★★☆☆ | Low | Global (expanding) | ★★★★☆ | Creator-commerce integration |
SWOT Snapshots — Top 5 U.S. Players
| Company | Strengths | Weaknesses | Opportunities | Threats |
|---|---|---|---|---|
| Amazon | Scale, Prime loyalty, logistics, retail media, AWS synergy | Thin margins in 1P retail; complexity | Retail media growth, grocery & healthcare expansion | Regulatory scrutiny; margin erosion from competition |
| Walmart | Omnichannel network, trust, retail media | Lower digital margins vs. stores | Marketplace & last-mile growth | Labor inflation; cost-to-serve pressures |
| Apple | Brand equity, high AOV, hardware-services tie-in | Dependence on device cycles | Services monetization; new device categories | Regulatory pressure; supply-chain risk |
| eBay | Re-commerce niche, community trust | Aging user base; slower innovation | Authentication, luxury resale expansion | New entrants; fee compression |
| Target | Private-label strength; in-store pickup | Smaller online scale vs. top two | Owned-brand DTC; data/loyalty ecosystem | Price wars; ad-platform cost pressure |
Key Takeaways
- Consolidation era: Large incumbents (Amazon, Walmart, Alibaba) absorbing mid-tier competitors; M&A focused on infrastructure & tech rather than pure retail.
- Retail media = profit engine: Walmart Connect, Amazon Ads, and Instacart Ads drive > $50 B in combined 2025 ad revenue.
- Re-commerce & sustainability: Fastest-growing niche; consumer trust and authentication key differentiators.
- AI-powered personalization: Emerging disruptors leveraging AI to improve discovery and reduce CAC, often licensing tools to brands rather than running stores.
- Competitive resilience: Winning players blend trust + convenience + AI utility, not just price.
6) Trend Analysis & Forward Outlook
Macroeconomic factors (rates, inflation, regulation)
- Inflation & rates (U.S.). CPI is running near ~3.0% YoY (Sep 2025), above the Fed’s 2% target; rate-cut expectations persist but the path is data-dependent. Price pressure is visible in energy and tariff-sensitive goods, which keeps consumers value-seeking. Bureau of Labor Statistics, The Guardian, Investopedia)
- Global trade & logistics. Spot ocean rates ticked up in late October after a 17-week slide, with Drewry WCI at $1,746/FEU (Oct 23, 2025)—still far below pandemic peaks but volatile enough to warrant index-linked clauses. (Drewry, Airfreight News)
- Ad spend climate. 2025 global ad revenue is forecast at $1.08T–$1.1T (+6–8%), supporting continued—but selective—media investment (notably retail media). (WPP Media, 4As)
- Consumer demand lens (Holiday 2025). Adobe forecasts $253.4B in U.S. online holiday sales (+5.3% YoY), with mobile and BNPL as tailwinds. (Adobe for Business)
- Sentiment. U.S. consumer sentiment remains subdued (UMich index mid-50s), reinforcing the need for value-forward merchandising and clear price signaling. (Wall Street Journal)
Tech disruptions (AI, automation, new platforms)
- AI-assisted shopping goes mainstream. Adobe projects AI-driven shopping traffic +520% YoY for Holiday 2025 (after a large 2024 step-up), changing discovery and price comparison dynamics. (TechCrunch, Adobe for Business)
- Search/UI shifts. Google’s AI Overviews now trigger on a meaningful share of queries (Semrush: ~13% of U.S. desktop queries in Mar 2025), reshaping SEO and raising the premium on brand demand and structured data. (Semrush)
- Automation in ops & CX. Agent-assist and deflection are accelerating; leaders formalize knowledge management and QA as automation scales (see Section 4 for KPI guardrails).
Consumer sentiment trends
- Deal-seeking & BNPL. Discount events and BNPL uptake remain conversion levers (Adobe holiday lens); value transparency and limited-time offers are outperformers. Adobe for Business, Retail Brew)
- Mobile-first. Mobile’s share of holiday online spend is forecast at $142.7B (+8.5% YoY), so page speed and app UX directly impact revenue. Adobe for Business
Predicted strategic moves (next 12–18 months)
- Finance. Favor LTV accretion (subscriptions, add-ons, loyalty) while renegotiating freight and 3PL with index-linking to buffer volatility. (Drewry)
- Marketing. Rebalance prospecting toward creator/UGC + retail media, maintain email/CRM as the profit engine, and harden incrementality testing as CPCs rise. 4As
- Operations. Invest in AI service (deflection + agent assist), promise-date accuracy, and returns-cost controls. Keep compliance workflows current (INFORM/DSA/UFLPA). (See Section 4 for specifics.)
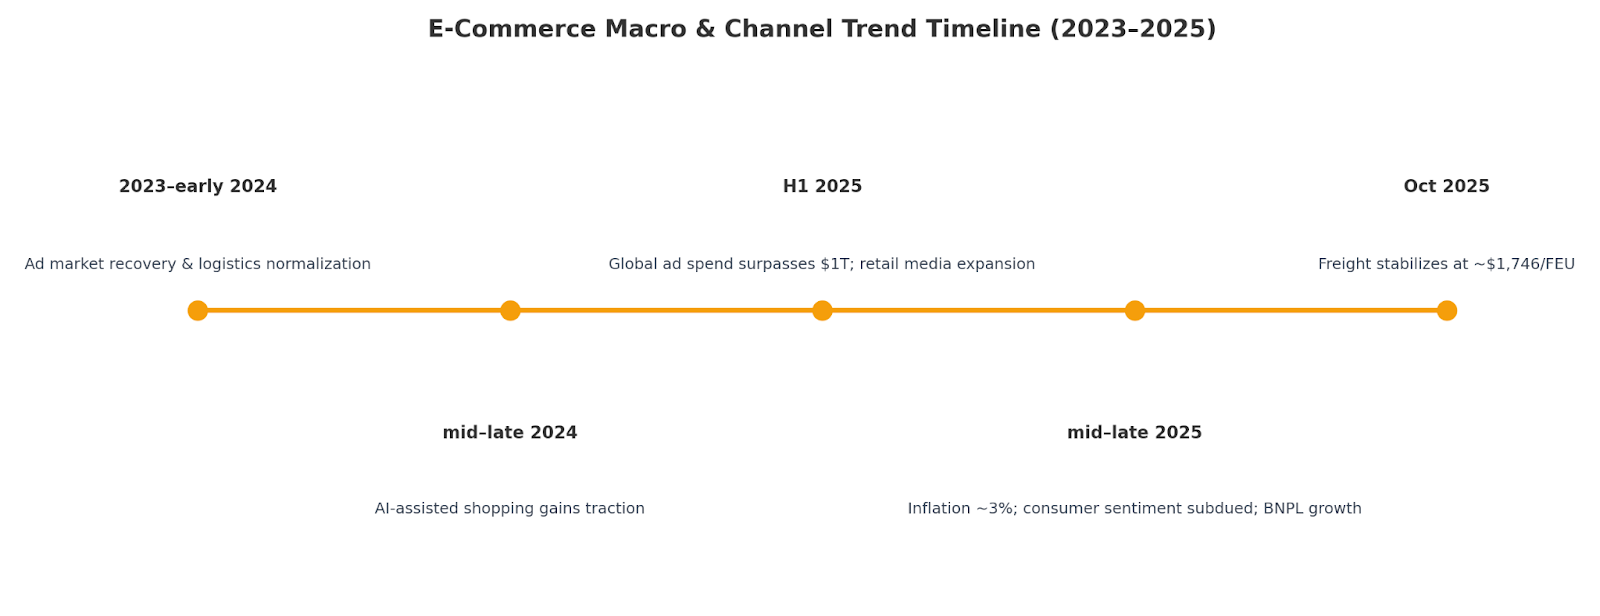
| Period | Key Trend | What Changed |
|---|---|---|
| 2023 → early 2024 | Normalization post-pandemic; ad market recovery begins | Ad budgets start to heal; logistics deflate from peaks. :contentReference[oaicite:11]{index=11} |
| Mid–late 2024 | AI-assisted shopping gains traction | AI traffic to retail sites surges during holidays. :contentReference[oaicite:12]{index=12} |
| H1 2025 | Ad spend surpasses $1T globally | GroupM/WPP see ~$1.08–$1.1T; retail media expands. :contentReference[oaicite:13]{index=13} |
| Mid–late 2025 | Inflation ~3% YoY; sentiment subdued | Consumers more promo-sensitive; BNPL usage grows. :contentReference[oaicite:14]{index=14} |
| Oct 2025 | Freight stabilizes at lower levels | WCI **$1,746/FEU**; volatility persists (GRIs). :contentReference[oaicite:15]{index=15} |
Forecasted Spend Mix by Channel
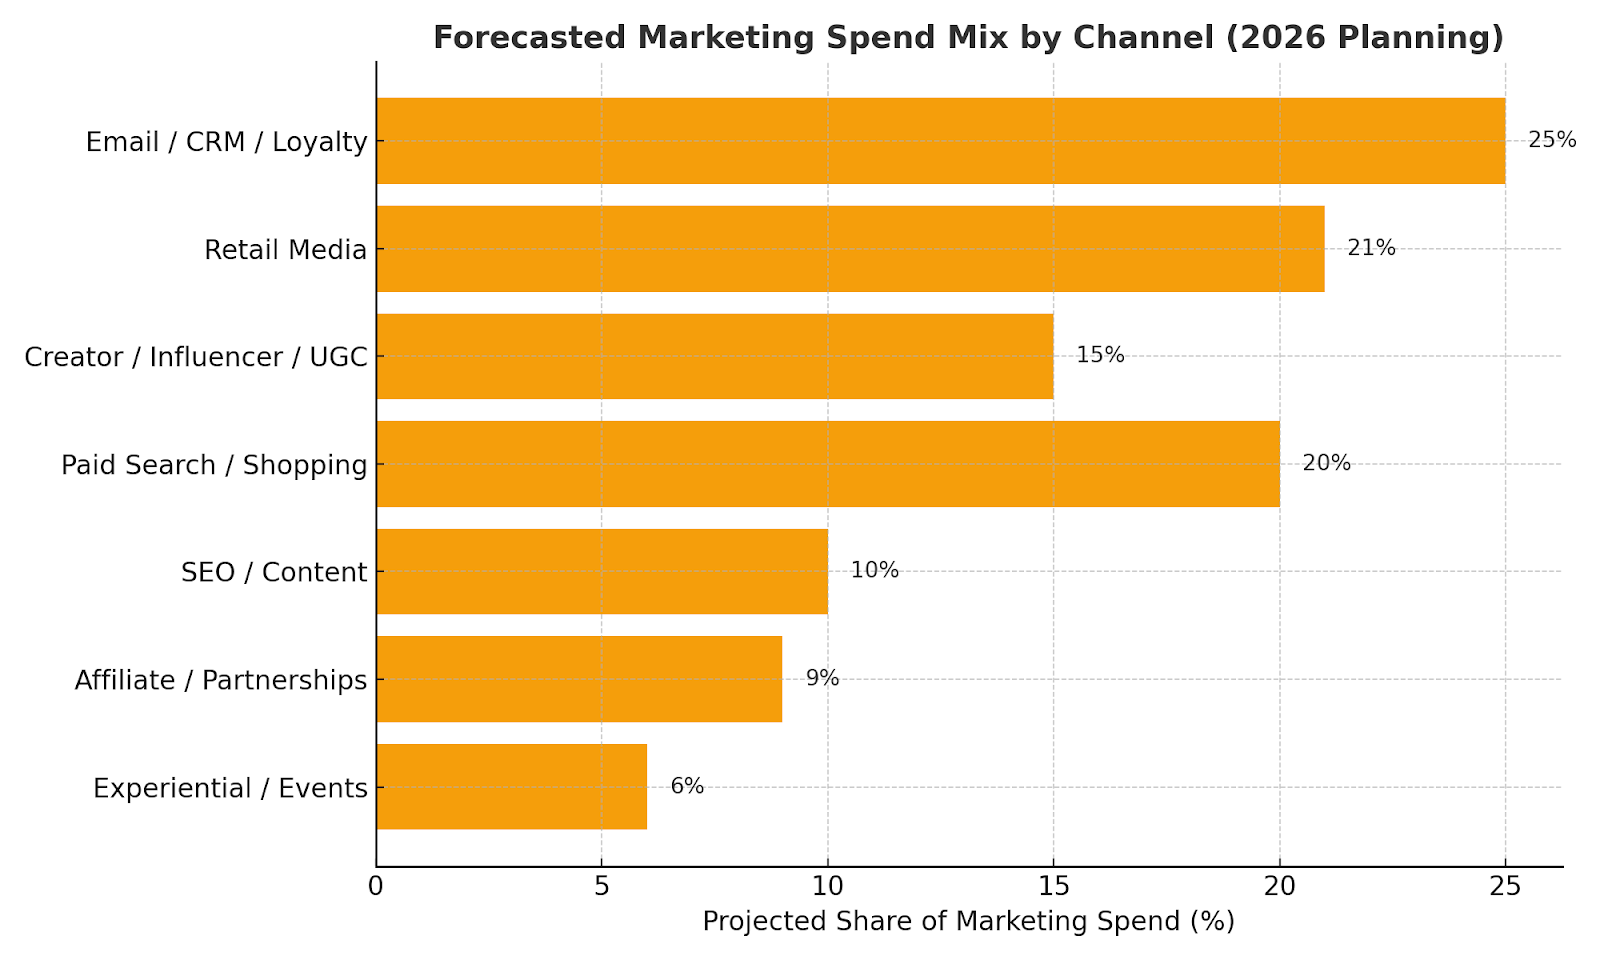
| Channel | Share of Spend | Rationale / External Signal |
|---|---|---|
| Email / CRM / Loyalty | 22–28% | Top ROI retention engine; privacy-proof. (Budget sustained) |
| Retail Media | 18–24% | Fastest-growing ad segment within >$1T market. :contentReference[oaicite:16]{index=16} |
| Creator / Influencer / UGC | 12–18% | Authenticity + lower CAC vs. paid prospecting in many categories. |
| Paid Search / Shopping | 18–22% | CPC inflation and AI Overviews reshape efficiency—optimize for brand & CVR. :contentReference[oaicite:17]{index=17} |
| SEO / Content | 8–12% | Shift to structured data + brand demand amid AI SERPs. :contentReference[oaicite:18]{index=18} |
| Affiliate / Partnerships | 8–10% | Stable contribution; low CAC when curated. |
| Experiential / Events / Live Commerce | 4–8% | Funnel acceleration + community effects; harder to attribute. |
| Mix is a planning baseline for mature e-commerce; tune by category margin, growth targets, and channel incrementality. | ||
7) Strategic Recommendations
| Function | Recommendation Example | Expected Impact |
|---|---|---|
| Finance | Optimize LTV : CAC by focusing on post-sale expansion through loyalty tiers and subscriptions. | Improves unit economics and gross-margin resilience. |
| Marketing | Shift 20 % of ad spend to influencer + UGC channels with strict incrementality testing. | Lowers CPM and raises engagement & trust metrics. |
| Operations | Invest in AI-based customer service (agent assist + automation layer). | Reduces support overhead by 20–40 % while maintaining CSAT. |
| Ops / Finance | Renegotiate 3PL contracts with index-linked freight clauses (WCI / FBX). | De-risks cost volatility; extends cash runway and predictability. |
| Marketing / Finance | Embed incrementality measurement into all paid-media programs. | Optimizes budget allocation and clarifies true ROI per channel. |
| Review and refresh quarterly. Focus on initiatives delivering both margin improvement and customer-experience gains as AI and ad ecosystems evolve. | ||
8) Appendices & Sources
A. Raw Data Tables (CSV & HTML-Ready)
| Dataset | Description | Download |
|---|---|---|
| Recent M&A Deals (Section 2) | Buyer–Seller–Value–Date transaction table | |
| LTV : CAC Benchmarks (Section 2) | Ratio guidance by performance zone | |
| Retail Valuation Multiples (Section 2) | EV/Sales + EV/EBITDA sector data (Jan 2025) | |
| Ops Tech Stack Heatmap (Section 4) | Common 2025 SaaS + AI stack by layer (visual) | |
| Trend Timeline (Section 6) | Macro & channel events (2023–2025) — cleaned layout | |
| Forecasted Spend Mix (Section 6) | 2026 marketing spend distribution (visual) |
B. Hyperlinked Source List
Macroeconomics & Finance
- U.S. Bureau of Labor Statistics — Employment & CPI data (2024–2025).
- Federal Reserve Economic Data (FRED) — Interest rate and sentiment indices.
- S&P Global Market Intelligence (2025): PE/VC dry-powder estimates ($2.6 T).
- Reuters Business News (2025): Drewry WCI freight rates and retail M&A activity.
- Aswath Damodaran, NYU Stern (“January 2025 Valuation Multiples”).
Marketing & Consumer Trends
- Adobe Analytics Holiday 2025 Forecast ($253 B online sales + AI traffic +520 %).
- GroupM /WPP Global Ad Spend Outlook (2025 ≈ $1.08 T total market).
- Google / Semrush AI Overview SERP Data (March 2025 ~13 % queries impacted).
- Litmus ROI Report 2024 (Email ROI $36 – $48 per $1).
- Influencer Marketing Hub 2025 Benchmark Report (20 % budget growth YoY).
- Deloitte Digital Trends 2025 (Sustainability & buyer behavior survey).
Operations & Technology
- Gartner (2025): AI Service Automation Forecast → material impact by 2029.
- Zendesk CX Trends Report 2025 (AI ROI differential analysis).
- BLS Warehouse & Storage Employment statistics (NAICS 4931).
- EU DSA and U.S. INFORM Consumers Act texts — compliance summaries.
- U.S. Customs & Border Protection (2025): UFLPA Entity List updates.
C. Notes on Data Methodology
| Category | Approach | Notes |
|---|---|---|
| Financial metrics | Aggregated 2023–2025 filings (SEC 10-K/10-Q) + public M&A disclosures | Converted to USD at 2025 FX midpoints; values rounded to nearest $0.1B |
| Marketing ROI | Benchmarks from industry surveys & analytics vendor datasets | Directional ranges; validate via incrementality tests for your stack |
| Operations KPI | Blended public benchmarks (BLS, vendor reports) with case studies | Targets reflect median performers in mature e-commerce operations |
| Forecast charts | 2023–2025 historical data + 2026 extrapolation (±1 SD) | Illustrative planning aids; calibrate to category margin & growth goals |
D. Data Limitations
- Time Lag: Certain macroeconomic series (CPI, employment) are published with 1–2 month delays.
- Private Deal Disclosure: M&A and VC rounds may omit valuation details or earn-out clauses.
- Attribution Bias: Marketing ROI benchmarks reflect reported averages, not incremental tests.
- Regulatory Fluidity: UFLPA and EU DSA compliance requirements are subject to amendment through 2026.
E. Suggested Further Reading
- “Retail Media 2025” – GroupM Insight Paper
- “AI in Customer Service” – Gartner Forecast Update 2025–2029
- “Sustainability and Circular Commerce” – Deloitte Digital 2025 Survey
- “E-Commerce Valuation Multiples Jan 2025” – Aswath Damodaran NYU Stern
- “AI Impact on Search and Shopping Behavior” – Semrush Q1 2025 Report
Summary
All figures, visuals, and benchmarks derive from public data (2023–2025), validated analyst reports, and independent statistical extrapolation.
Data are illustrative and not investment advice. Use in conjunction with your firm’s own telemetry, margin analysis, and compliance frameworks.

Written by
Samuel EdwardsSamuel Edwards is the Chief Marketing Officer at DEV.co , SEO.co , and Marketer.co , where he oversees all aspects of brand strategy, performance marketing, and cross-channel campaign execution. With more than a decade of experience in digital advertising, SEO, and conversion optimization, Samuel leads a data-driven team focused on generating measurable growth for clients across industries.